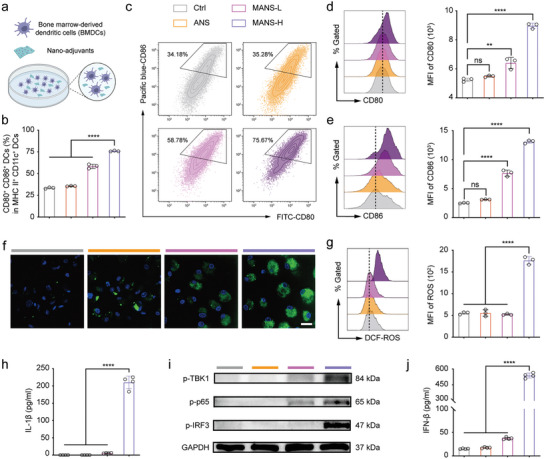
Figure 3.

MANS‐H adjuvant potentially triggers BMDC maturation, ROS production, and activation of the inflammasome and STING‐IFN‐β pathway. a) Illustration shows the procedure to induce the BMDC maturation (created with permission by BioRender). b) Flow cytometry shows the proportion of CD80+ CD86+ DCs (in the MHC II+ CD11c+ DCs) treated with different NS adjuvants (n = 3). c) Representative counterplot of CD80+ CD86+ DCs. d‐e) Representative histogram overlays and median fluorescence intensity (MFI) of the expression of d) CD80 and e) CD86 on BMDCs after incubation with ANS, MANS‐L or MANS‐H (n = 3). f) Confocal microscopy images and g) flow cytometry analysis shows intracellular ROS levels in BMDCs induced by ANS, MANS‐L, or MANS‐H (n = 3). h) ELISA analysis summarizes IL‐1β secretion levels in BMDMs treated with PBS or NS adjuvants for 48 h (n = 4). i) Western blot analysis shows the expression levels of pTBK1, p‐p65 and ‐IRF3 in BMDCs treated with PBS or NS adjuvants for 20 h (n = 3). j)ELISA analysis of IFN‐β secretion levels in the supernatants of BMDCs (n = 4). Data are presented as means ± SD. P values were determined by a one‐way ANOVA test. ns, p > 0.05, **p < 0.01, ****p < 0.0001.
