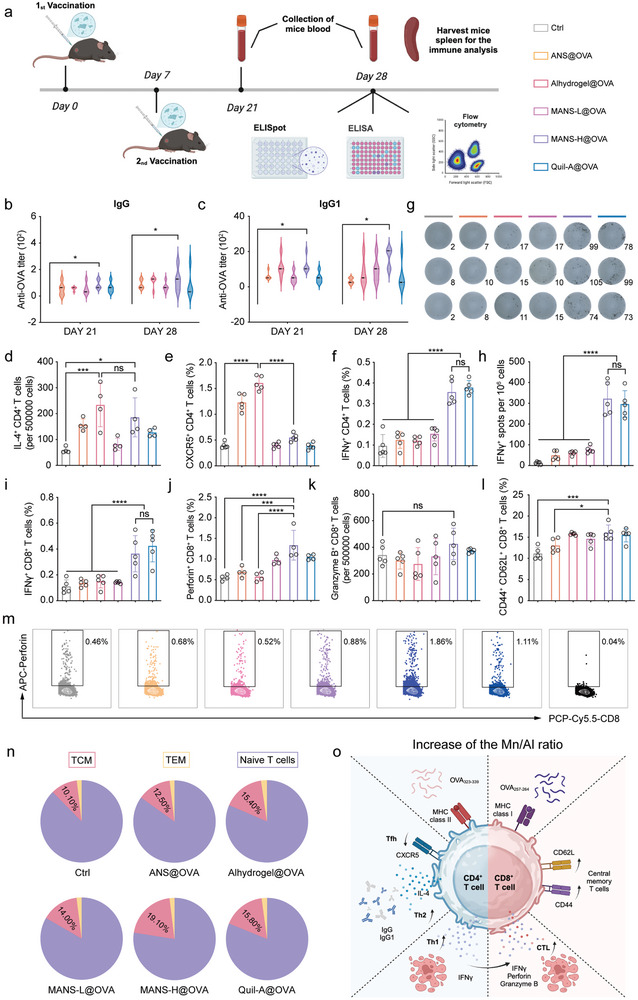
Figure 8.

MANS‐H adjuvanted vaccine induces durable and potent humoral and cellular immunity. a) The experiment timeline: C57BL/6 mice were vaccinated twice on day 0 and day 7. Blood samples were collected on day 21 and day 28, and the spleens were harvested at the endpoint for further analysis (created with permission by BioRender). b–c) Serum IgG b) and IgG1c) antibody titers against OVA in vaccinated or control mice (n = 5). d–f) The number of OVA323‐339specific IL‐4+CD4+ T cells in 500 000 cells d), the fractions of OVA323‐339‐specific CXCR5+CD4+ T cells e) and OVA323‐339specific IFN‐γ+ CD4+ T cells f) in spleens derived from vaccinated or control mice (n = 4 or 5). g‐h) Representative digital photos show the ELISPOT spots of OVA257‐264‐specific CD8+ T cells secreting IFN‐γ+ g) and numbers of OVA‐specific IFN‐γ+CD8+ T cells per 106 cells h) (n = 5). i‐k, m) Flow cytometry analysis shows the proportions of OVA257‐264specific IFN‐γ+CD8+ T cells i), perforin+CD8+T cells j), and granzyme B+CD8+ T cells k), and representative dot plots of perforin+CD8+T cells m) in spleens from vaccinated or control mice (n = 4 or 5). l, n) Flow cytometry analysis shows the fractions of CD44+CD62L+CD8+ T cells (TCM, l), and the proportion sums of TCM, TEM, and naïve T cells presented in pie charts in spleens from vaccinated or control mice (n = 5). o) A schematic illustration shows the favored subtypes of adaptive immune response mediated by the increased ratio of Mn to Al (created with permission by BioRender). Data are presented as means ± SD. P values were determined by a one‐way ANOVA test. ns, p > 0.05, *p < 0.05, ***p < 0.001, ****p < 0.0001.
