
Figure 9.
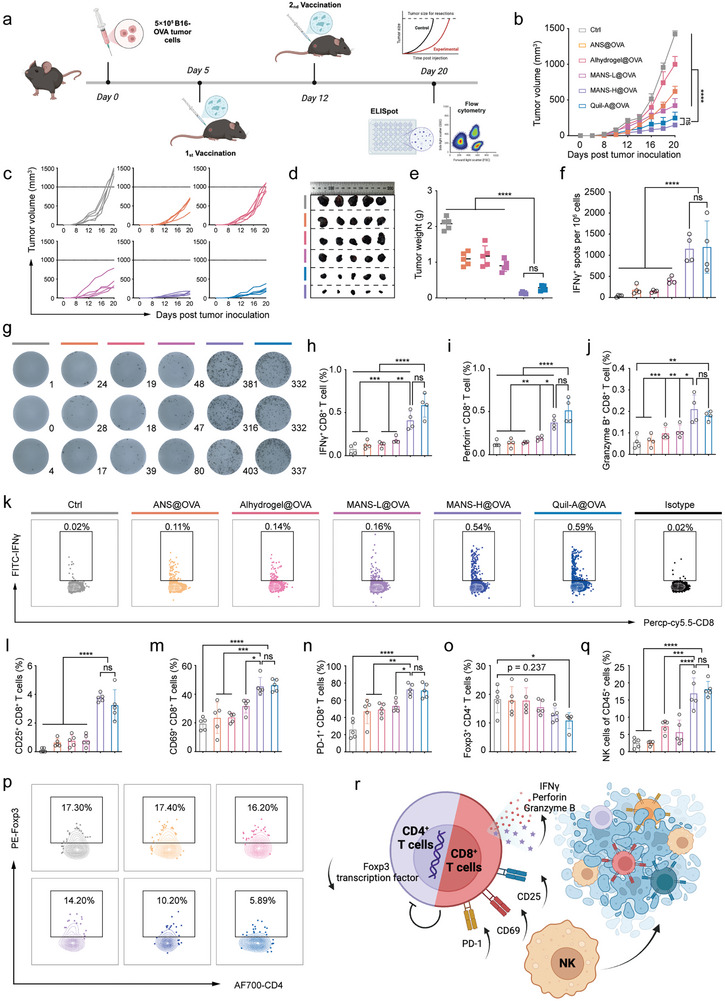
MANS‐H adjuvanted OVA vaccine significantly suppresses B16‐OVA tumor growth by boosting polyfunctional T cell immune response. a) The experimental timeline of the therapeutic regimen of the B16‐OVA melanoma model: C57BL/6J mice were subcutaneously inoculated with 5 × 10⁵ B16‐OVA cells on day 0 and then vaccinated twice with weekly intervals on day 5 and day 12 (created with permission by BioRender). b) Average and c) individual B16‐OVA tumor growth volume curves of immunized and unimmunized mice (n = 5). d) Digital photos and e) weights of tumor samples harvested at the endpoint (n = 5). f) ELISPOT analysis shows the numbers of OVA‐specific IFN‐γ+CD8+ T cells per 106 splenocytes and g) the representative digital photos of CD8+ T cells secreting IFN‐γ dots in the spleen after restimulation with OVA257‐264 peptides (n = 4). h–k) Flow cytometry analysis shows the proportions of h) OVA‐specific IFN‐γ+CD8+ T cells, i) perforin+CD8+ T cells and j) granzyme B+ CD8+ T cells, and representative dot plots of k) IFN‐γ+CD8+ T cells in spleens (n = 4). l–p) Flow cytometry analysis summarizes the percentages of B16‐OVA tumor‐infiltrating l) CD25+CD8+ T cells, m) CD69+CD8+ T cells, n) PD‐1+CD8+ T cells, o) Foxp3+CD4+ Tregs and q) NK cells, and p) representative dot plots of Foxp3+CD4+ T cells (n = 5). r) A schematic illustration shows the cytolytic functions of polyfunctional effector CD8+ T cells and NK cells mediate potent anti‐tumor effect (created with permission by BioRender). Data are presented as means ± SEM (B) or SD (e,f, h–j, l–o, and P) (n = 5). P values were determined by two‐way ANOVA, Tukey's multiple‐comparison test (b), or one‐way ANOVA, Tukey's multiple‐comparison test (e,f, h–j, l–o, and p). n.s., not significant; * p < 0.05; ** p < 0.01; *** p < 0.001; **** p < 0.0001.