Figure 10.

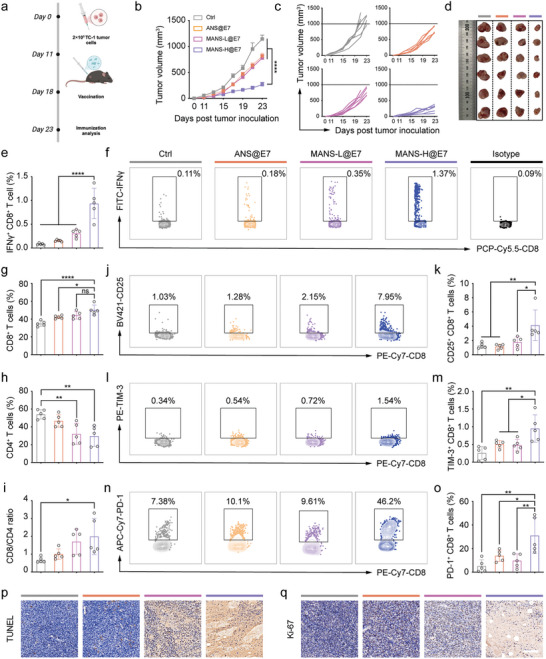
MANS‐H adjuvanted E7 vaccine remarkably regresses the HPV E7‐expressing tumor growth. a) A scheme shows the experimental timeline: C57BL/6J mice were subcutaneously inoculated with 2 × 10⁵ TC‐1 cells on day 0, and then vaccinated with diverse E7 vaccine formulations on day 11 and day 18 (created with permission by BioRender). b) Average and c) individual TC‐1 tumor growth curves of unimmunized and immunized mice (n = 6). d) Digital photos of tumor samples harvested at the endpoint on day 23 (n = 6). e,f) The splenocytes were re‐stimulated with E7 peptide for the detection of E7‐specific IFN‐γ+ CD8+ T cells. e) Flow cytometry analysis shows the percentages and f) the representative dot plots of E7‐specific IFN‐γ+CD8+ T cells (n = 5). g‐o) Flow cytometry analysis shows the proportions of g) CD8+ T cells, h) CD4+ T cells and the ratios of i) CD8+/CD4+ T cells in CD45+ cells, the representative dot plots and bar charts presenting the proportions of j,k) CD25+CD8+ T cells, l,m) TIM‐3+CD8+ T cells and n,o) PD‐1+CD8+ T cells pre‐gated on CD8+ T cells in TC‐1 tumors derived from unimmunized and immunized mice (n = 5). p,q) Representative immunofluorescence images of tumor tissue sections stained with p) TUNEL or q) Ki‐67. Scale bars: 100 µm. Data are presented as means ± SEM (b) or SD (e, g–i, k, m and o). P values were determined by two‐way ANOVA, Tukey's multiple‐comparison test (b), or one‐way ANOVA, Tukey's multiple‐comparison test (e, g–i, k, m and o). n.s., not significant, * p < 0.05; ** p < 0.01; **** p < 0.0001.
