Figure 5.

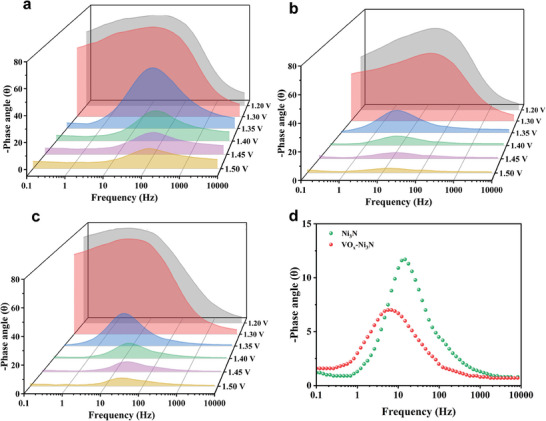
The operand electrochemical impedance spectroscopy characterization: Bode plots of a) V─Ni(OH)2, b) VOx−Ni3N, and c) Ni3N electrode for EOR in different potentials. d) Bode phase plots of VOx−Ni3N and Ni3N at 1.4 V RHE.

The operand electrochemical impedance spectroscopy characterization: Bode plots of a) V─Ni(OH)2, b) VOx−Ni3N, and c) Ni3N electrode for EOR in different potentials. d) Bode phase plots of VOx−Ni3N and Ni3N at 1.4 V RHE.