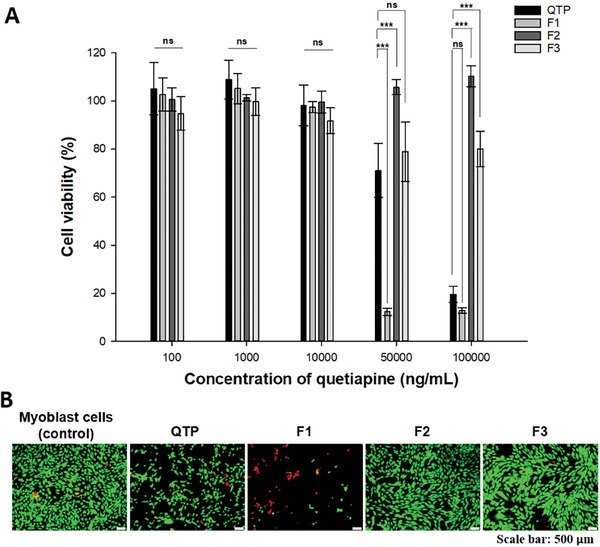
Figure 4.

Cytotoxicity of three NSPs (F1–F3). A) Cell viability after treatment with the QTP solution and three NSPs (F1–F3) at different QTP concentrations (100, 1000, 10 000, 50 000, and 100 000 ng mL−1) for 24 h. B) Live/dead images of cell viability after treatment with QTP solution and three NSPs at 100 000 ng mL−1 for 24 h. Data are expressed as mean ± standard deviation (n = 6). Significant differences were analyzed using one‐way analysis of variance (ANOVA), followed by the Bonferroni post hoc test: ***p < 0.001, **p < 0.01, and *p < 0.05; ns: no significant difference (p > 0.05).
