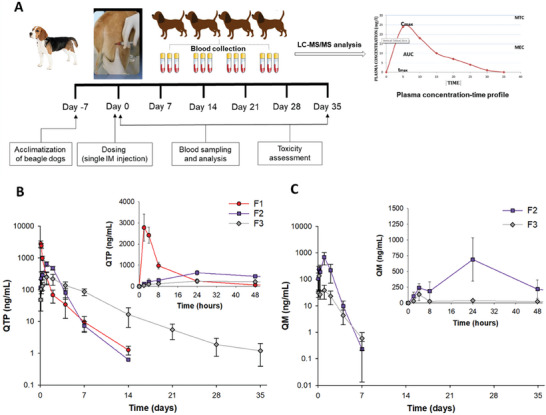
Figure 5.

Pharmacokinetic profiles following IM injection of three NSPs (F1–F3) to beagle dogs (35 mg kg−1 as QTP). A) Experimental schedule for the in vivo study. B,C) Plasma concentration–time profiles of QTP (B) and QM (C). Data represents mean ± standard deviation (n = 4).
