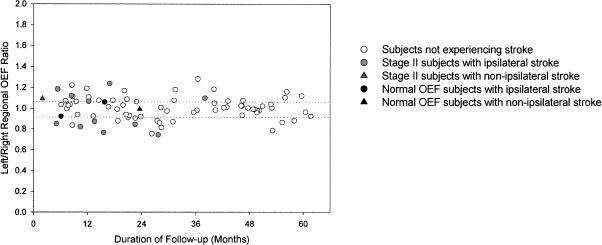
Figure 3.
The frequency of stroke may be higher during the first 2 years of follow-up for the 81 symptomatic patients with atherosclerotic carotid artery occlusion enrolled in the St. Louis Carotid Occlusion Study. The left axis is the left-to-right hemispheric ratio of OEF. The dotted lines indication the normal range—values above or below the line indicate increased OEF beyond the normal range. The x-axis indicates the duration of follow-up after enrollment for patients without stroke and the time of stroke after enrollment for patients suffering stroke during the follow-up period. OEF, oxygen extraction fraction.

