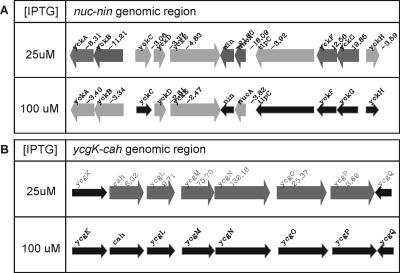
FIG. 3.
(A) The transcriptional response of the nucA-nin genome region in the ItrxA mutant cells; (B) the transcriptional response of the cah-ycg genome region in the ItrxA mutant cells. Thin black arrows indicate no significant difference (n-fold) from the wild type. Thick gray arrows indicate a transcriptional response upon thioredoxin A depletion (P < 0.025). Differences (n-fold) in expression levels are given next to the gene names.

