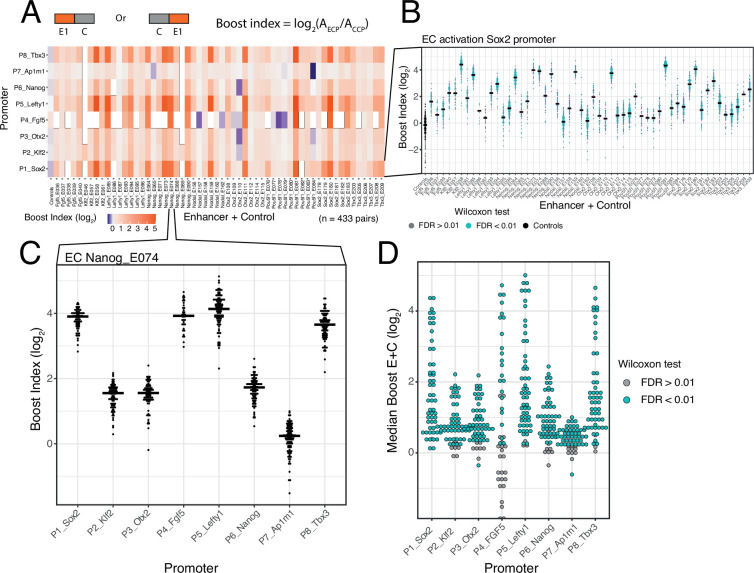
Figure 2. Effects of single enhancers across promoters.
(A) Enhancer-promoter median boost index matrix of single enhancers. For each single enhancer a median boost index (see figure and Methods, log2(Activity_Combination/Activity_control-control_baseline)) was calculated across all enhancer-control combinations for that particular enhancer in any position and orientation, the baseline is the median activity of the promoter across all control-control combinations. For each control-control combination a boost index was calculated as the activity of the control-control combination over the median activity of all controls. A median control-control boost index was calculated based on this. Colour coding of the matrix corresponds to the median boost indexes, white spaces are missing data. (B) Distribution of boost indices for all enhancer+control combinations for the Sox2 promoter. Leftmost column corresponds to the boost index distribution for all control-control combinations for the Sox2 promoter. Each dot represents one enhancer+control combination. Horizontal lines correspond to the median of each distribution (same median as represented in the matrix in A). (C) Distribution of boost indices for all enhancer+control combinations for the enhancer Nanog_E074 across all promoters. Each dot represents one enhancer+control combination. Horizontal lines correspond to the median of each distribution. (D) Distribution of median boost indices for each single enhancer across promoters. Each dot represents the median of an enhancer across all enhancer+control combinations for that enhancers (same median as represented in the matrix in A). Colouring in B and D represents the significance at a 1% false discovery rate (FDR) for a Wilcoxon test comparing boost index distributions between enhancer+control combinations and the controls for each enhancer.


