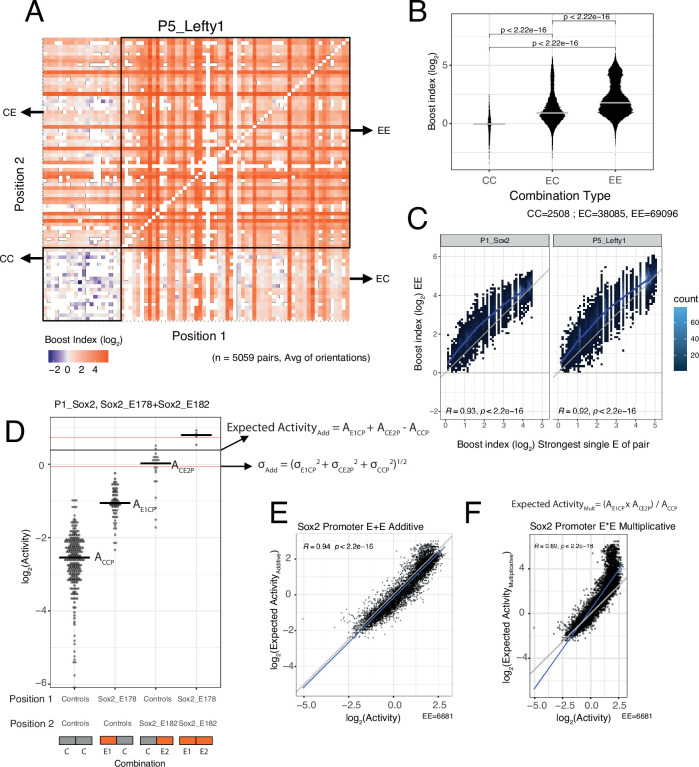
Figure 3. Effects of enhancer-enhancer (EE) combinations.
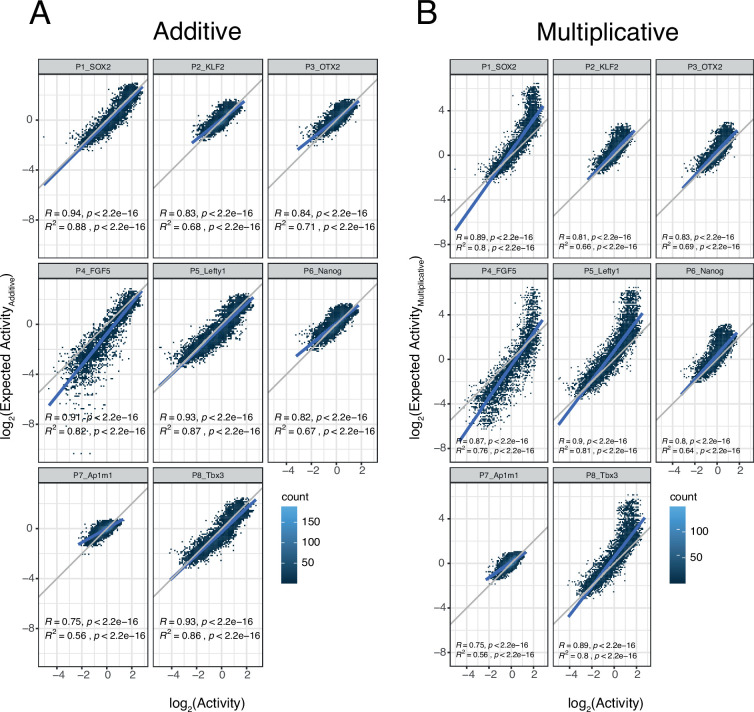
(A) Fragment-fragment combinatorial boost index matrix for the Lefty1 promoter. Each square represents one control-control (CC), enhancer-control (EC or CE), or EE combination. Colour coding corresponds to the average boost index for each combination across all orientations measured over the median control-control baseline. (B) Boost index distributions across all eight promoters for each combination type, control-control (CC), enhancer-control (EC regardless of position) or EE combinations. p-Values correspond to the result of a Wilcoxon test. (C) Relationship between observed boost index for each EE combination and the observed boost index of the strongest single enhancer of the pair for Sox2 and Lefty1 promoters. Blue lines represent the LOESS fit of the data. (D) Observed and expected additive activities for the Sox2_E178+Sox2_E182 combination with the Sox2 promoter and the individual activities of each of the elements. Each column represents the observed activities for the control-contol combinations, the enhancer-control combinations, and the EE combinations. The horizontal bars represent the median of each distribution. The horizontal black line represents the expected additive activity of the EE combination as calculated by the formula in the panel in the linear space. The horizontal red lines represent the propagated standard deviations of the expected additive activity of the EE combinations as calculated by the formula in the panel. (E and F) Relationship between observed and expected activities (additive in E, multiplicative in F) for all EE combinations for the Sox2 promoter. The blue lines represent the linear fit of the data. Grey diagonal line is the x=y identity line. In all panels R represents Pearson’s correlation coefficient. Expected activities are calculated in the linear space and then plotted in the log2 space.


