. 2024 Oct 28;12:RP91994. doi: 10.7554/eLife.91994

Figure 5. Non-linear responses of promoters to enhancer-enhancer combinations.

(A) Relationship between observed boost indices and average boost index across promoters for all shared enhancer-enhancer combinations. Blue lines represent the linear fit of the data. (B) Relationship between the slopes extracted from the linear fits in A and the baseline promoter activities derived from the control-control combinations. The formulae depict the relationship between the average boost indices and the observed boost indices of each promoter through the extracted slopes. For both panels R is Pearson’s correlation coefficient.

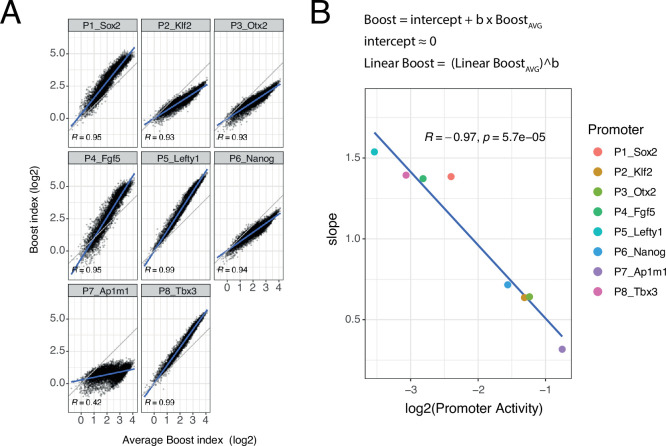
Figure 5.

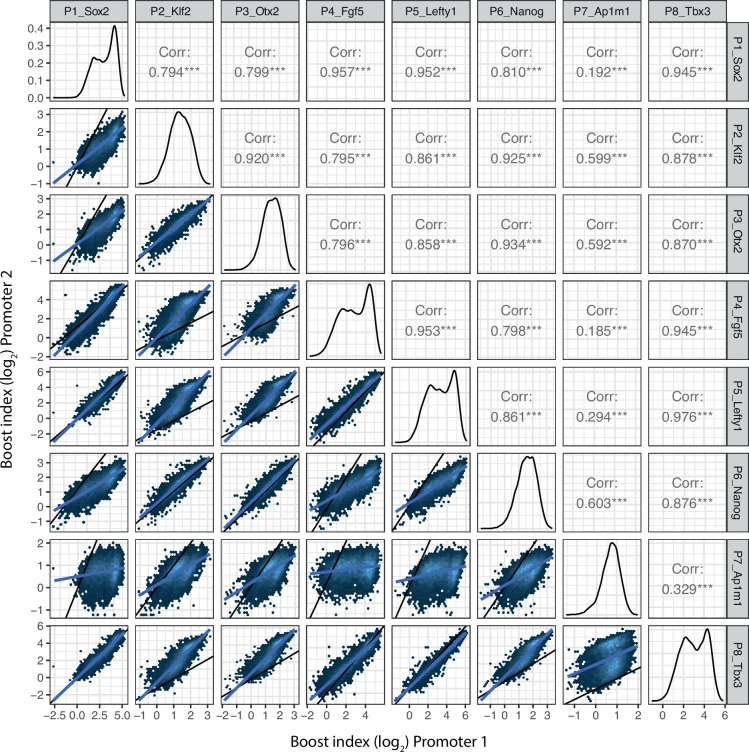
Figure 5—figure supplement 1. Promoter-promoter boost index correlations for all shared enhancer-enhancer combinations.

Figure 5—figure supplement 1.

Lower left panels represent the two-dimensional density plots of promoter-promoter boost index correlations. Middle panels represent the one-dimensional density plot of each promoter. Upper right panels are the Pearson’s correlation of the mirror lower left panels. Blue lines are the linear fit of the data.
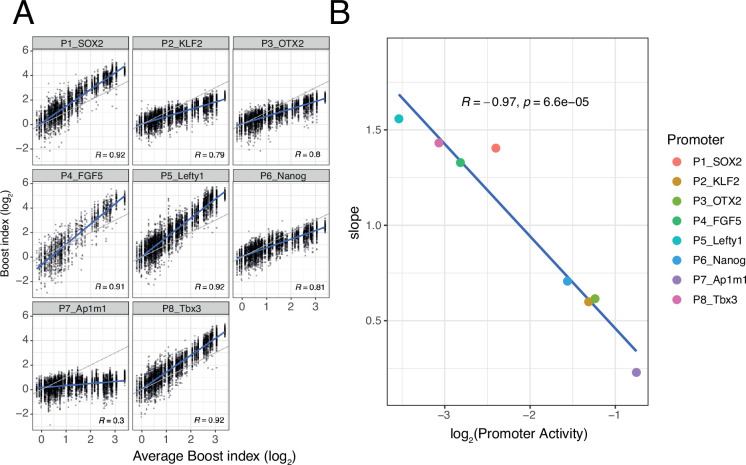
Figure 5—figure supplement 2. Non-linear responses of promoters to enhancer-control (single enhancers) combinations.

Figure 5—figure supplement 2.

(A) Relationship between observed boost indices of single enhancers and average boost index across promoters for all shared single enhancer-control combinations. Blue lines represent the linear fit of the data. (B) Relationship between the slopes extracted from the linear fits in A and the baseline promoter activities derived from the control-control combinations. For both panels R is Pearson’s correlation coefficient.