. 2024 Oct 28;13:RP94658. doi: 10.7554/eLife.94658

Figure 2. Tumor-infiltrating T cell receptor β (TCRβ) profiles in 28 colorectal cancer patients.

(A) A bar plot depicting the distribution of T cell receptor (TCR) clonotypes among 28 colorectal cancer (CRC) patients, categorized into two groups: those with a unique read count and those with read counts greater than or equal to 2 for each TCR clonotype. (B) The scatter plot illustrates the relationship between the Shannon-index and the number of TCR clones. (C) The rarefaction plot shows the variable between sample size and diversity among 28 CRC samples.

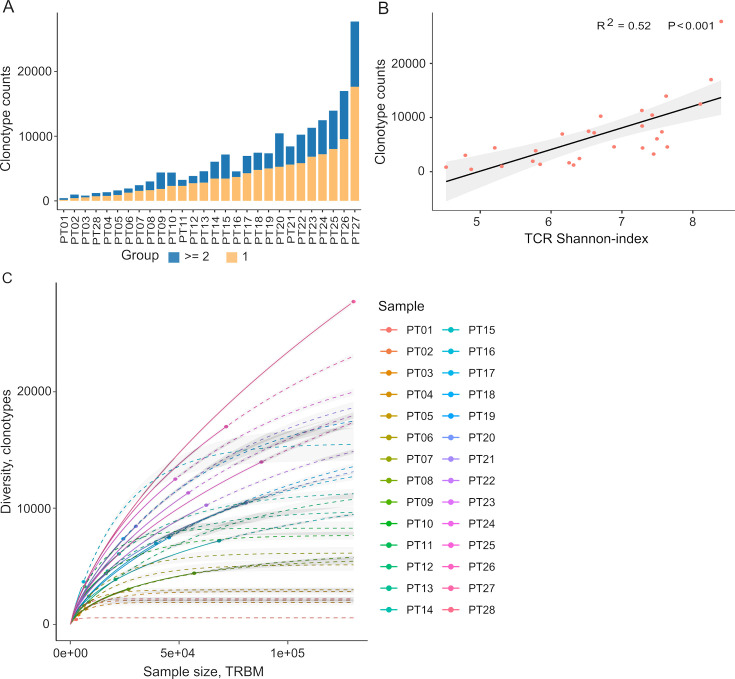
Figure 2.

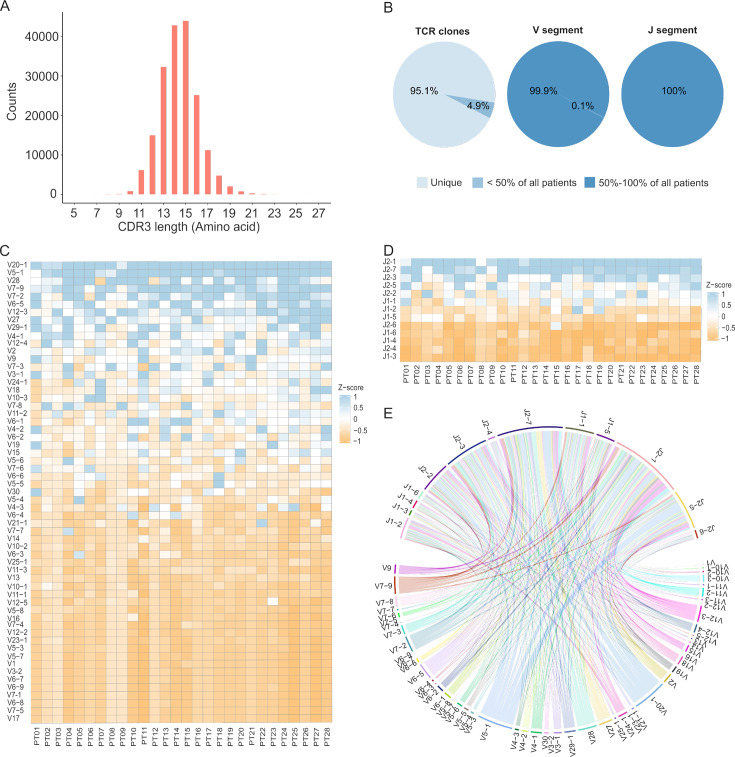
Figure 2—figure supplement 1. Quality control metrics for tumor-infiltrating lymphocyte (TIL) T cell receptor β (TCRβ) analysis.

Figure 2—figure supplement 1.

(A) Distribution of CDR3β lengths in total T cell receptor (TCR) clones. (B) The pie chart displays the recurrence rates of TCR clones, variable (V) segments, and joining (J) segments when the read count of TCR clones exceeds 01. The graph illustrates the uniqueness of TCR clones and the shared presence of both V and J segments. (C) The heatmap depicts the Z-scored read counts of V segments or (D) J segments across 28 samples. Some V and J segments were found to be dominant in all samples. (E) The chord diagram illustrates the rearrangement of V and J segments, revealing random V and J combinations, with a few combinations exhibiting high frequencies.
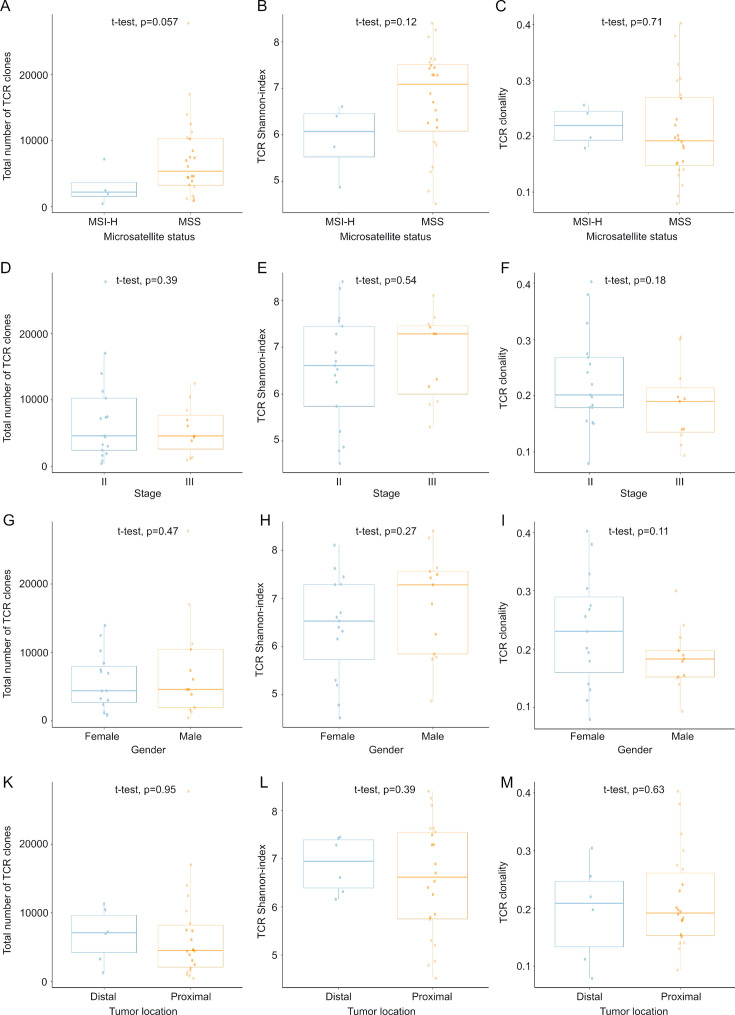
Figure 2—figure supplement 2. Association between tumor-infiltrating lymphocyte (TIL) T cell receptor β (TCRβ) profiles and patients' characteristics.

Figure 2—figure supplement 2.

The bar plot and dot plot compare T cell receptor (TCR) clones, Shannon index, and clonality between high microsatellite instability (MSI-H) and microsatellite stability (MSS) (A, B, C), stage II and III (D, E, F), female and male gender (G, H, I), and distal and proximal tumor locations (K, L, M).
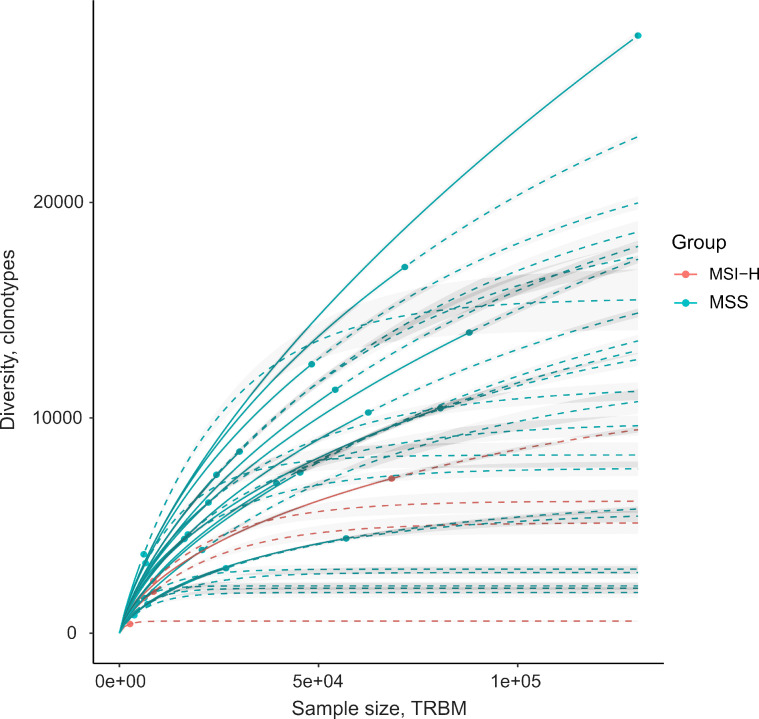
Figure 2—figure supplement 3. Rarefaction between microsatellite instability (MSI) and microsatellite stability (MSS) samples.

Figure 2—figure supplement 3.

The rarefaction plot illustrates the sample size and diversity of samples in two groups: MSI and MSS.