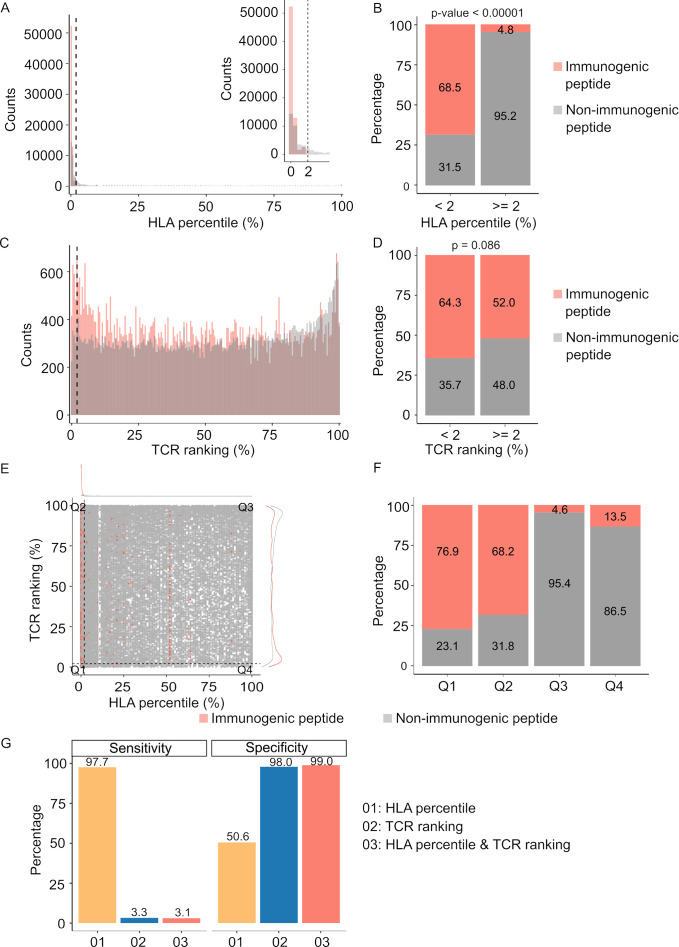
Figure 3. Peptide-T cell receptor (TCR) and peptide-human leukocyte antigen (HLA) interactions are two complementary determinants of neoantigen immunogenicity.
(A) The histogram displays the HLA percentile distribution of immunogenic antigens (red bar) and non-immunogenic peptides (gray bar). (B) The percentage of immunogenic antigens (red bar) and non-immunogenic peptides (gray bar) is compared between two groups based on HLA percentile:<2% and ≥ 2% (Chi-square test, p<0.00001). (C) The histogram displays the TCR ranking distribution of immunogenic antigens (red bar) and non-immunogenic peptides (gray bar). (D) The percentage of immunogenic antigens (red bar) and non-immunogenic peptides (gray bar) is compared between two groups based on TCR ranking:<2% and ≥ 2% (Chi-square test, p=0.086). (E) The scatter plot illustrates the relationship between the HLA percentile distribution and TCR ranking of immunogenic antigens (red bar) and non-immunogenic peptides (gray bar). (F) The percentage of immunogenic antigens (red bar) and non-immunogenic peptides (gray bar) is analyzed in four distinct groups based on cutoffs of HLA percentile and TCR ranking. (G) The bar plot illustrates the sensitivity and specificity of three neoantigen prioritization approaches: based on neoantigen-HLA binding affinity alone (yellow bar), neoantigen-TCR binding ranking alone (blue bar), and the combined method using both features (red bar).

