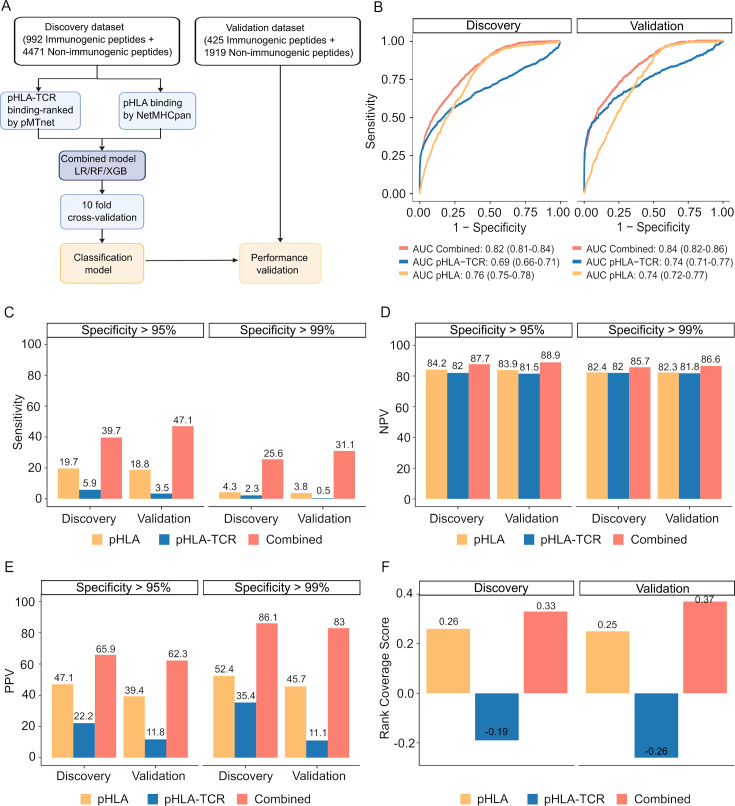
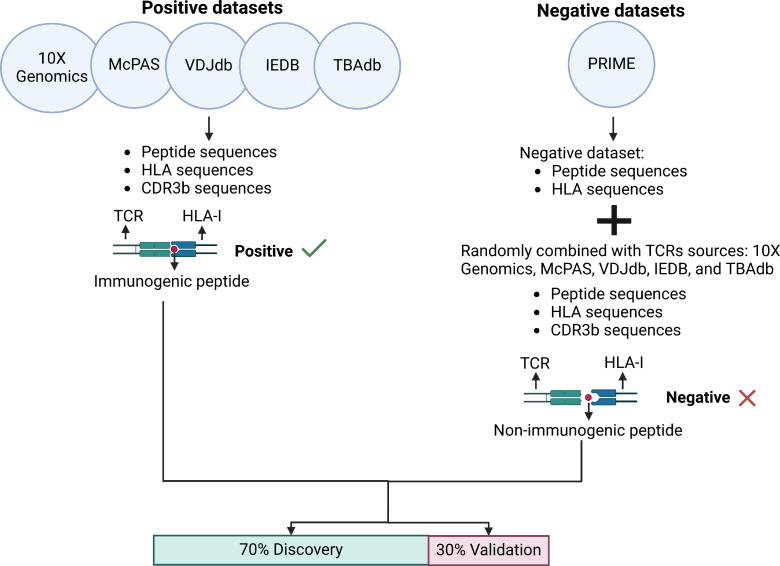
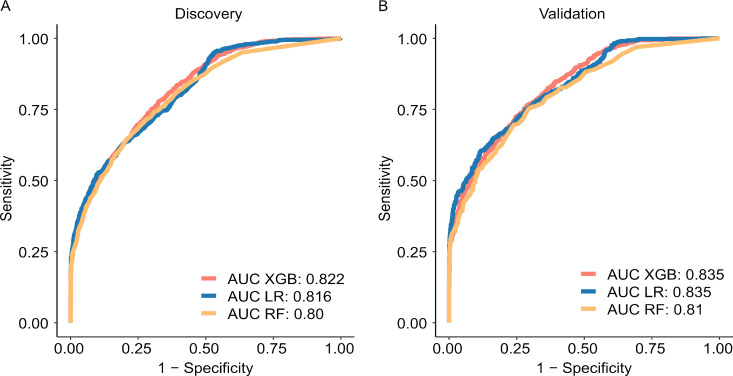
Figure 4. The combined model demonstrates improved sensitivity and specificity for neoantigen prioritization.
(A) The workflow for constructing the model. (B) The receiver operating characteristic (ROC) curves demonstrate the performance of both the combined model and individual models in both the discovery and validation cohorts. The bar graphs illustrate the sensitivity (C), negative predictive value (NPV) (D), and positive predictive value (PPV) (E) at specificity levels of at least 95% or 99% for both the combined and individual models in both the discovery and validation cohorts. (F) Ranking coverage scores for the specified models in either the discovery or validation cohorts.


