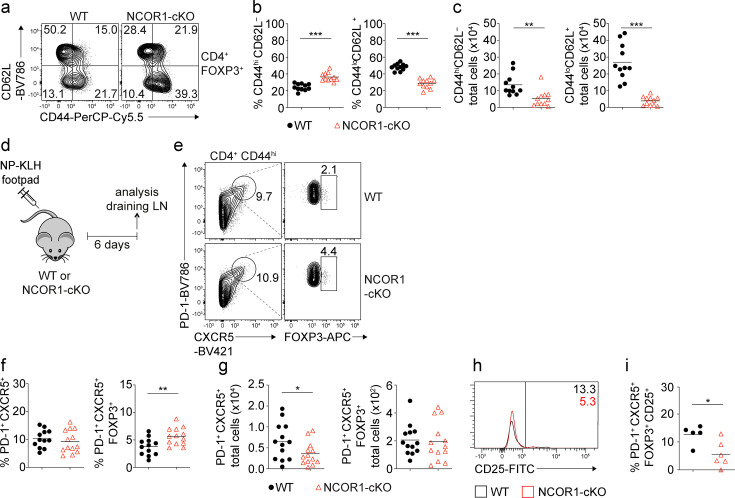
Figure 1. Loss of NCOR1 leads to a relative increase in CD44hiCD62L– effector Treg cells.
(a) Flow cytometric analysis of splenocytes isolated from wild-type (WT) and NCOR1-cKO mice showing CD44 and CD62L expression in CD4+FOXP3+ cells at steady-state. (b) Diagrams showing the percentage of CD44hiCD62L– (left) and CD44loCD62L+ (right) CD4+FOXP3+ cells of all mice analyzed as described in (a). (c) Total cell numbers of CD44hiCD62L– (left) and CD44loCD62L+ (right) CD4+FOXP3+ cells of all mice analyzed are described in (a). (d) Experimental immunization strategy: mice were injected s.c. with nitrophenol keyhole limpet hemocyanin (NP-KLH) and draining lymph nodes (LNs) analyzed six days later. (e) Flow cytometric analysis of cells isolated from draining LN of NP-KLH-immunized WT and NCOR1-cKO mice showing the expression of PD-1, CXCR5, and FOXP3 on CD4+CD44hi cells. (f) Diagrams showing the percentage of T follicular helper (Tfh) cells (CD4+CD44hiPD1+) (left) and T follicular regulatory (Tfr) cells (CD4+CD44hiPD1+CXCR5+FOXP3+) (right) of all mice analyzed as described in (d,e). (g) Total cell numbers of Tfh cells (CD4+CD44hiPD1+CXCR5+) (left) and Tfr cells (CD4+CD44hiPD1+CXCR5+FOXP3+) (right) of all mice analyzed as described in (d,e). (h) Flow cytometric analysis of cells isolated from draining LN of NP-KLH-immunized WT and NCOR1-cKO mice showing the expression CD25 in CD4+CD44hiPD1+CXCR5+FOXP3+ Tfr cells. (i) Percentage of CD25 expressing CD4+CD44hiPD1+CXCR5+FOXP3+ Tfr cells of all mice analyzed as described in (h). (a,e,h) Numbers indicate the percentages of cells in the respective quadrants or gates. (a–c) Cells were pre-gated on CD4 and FOXP3. (b,c,f,g,i) Each symbol indicates one mouse. Horizontal bars indicate the mean. *p<0.05, **p<0.01, and ***p<0.001; Unpaired two-tailed Student’s t-test. Data are representative (a,e,h) or show the summary (b,c,f,g,i) of at least eleven (b,c), twelve (f,g) or five (i) mice that were analyzed in at least two independent experiments.


