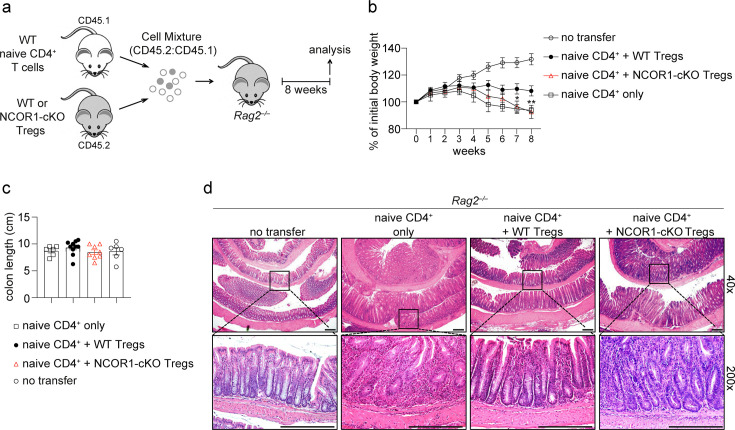
Figure 4. NCOR1 is essential for Treg cell-mediated protection in adoptive CD4+ T cell transfer colitis.
(a) Experimental protocol for adoptive transfer colitis. Control groups received naïve CD4+ T cells only or no cells at all (not shown). (b) Weight scores in percentages of initial body weight during the course of colitis in Rag2−/− recipient mice are shown. Data show the summary of at least eight mice (except control groups with six mice) of three independent experiments. *p<0.05, **p<0.01, and ***p<0.001 (two-way ANOVA analysis followed by Tukey’s multiple-comparisons test). For simplicity, significant differences are shown only between mice that received wild-type (WT) and NCOR1-cKO Treg cells. Of note, non-injected control mice gained significantly more weight (starting from around week 5) compared to all other groups. (c) Summary showing colon length from the various Rag2−/− recipient mice. (d) Colon swiss rolls were processed for hematoxylin and eosin (H&E) staining. The pictures in the bottom represent a 5x magnification of the black rectangle framed section in the top pictures. Magnification: 40x and 200x. Scale bar = 100µm. One representative picture is shown per condition.


