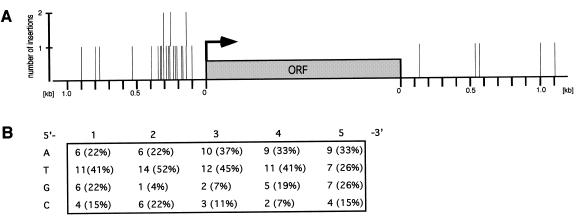
Figure 2.
Analysis of Tf1 integration sites within intergenic regions. (A) The location of all mapped Tf1 insertion sites with regard to the closest ORF (5′ or 3′ end) is shown. Bars indicate single Tf1 insertions. Long bars are used to represent two Tf1 insertions which occurred at about the same distance to the closest ORF (clone 8, 141 bp and clone 39, 144 bp; clone 2, 258 bp and clone 29, 261 bp; clone 21, 307 bp and clone 26, 308 bp). The arrow indicates the 5′ end of an ORF (grey box). (B) Composition of 5 bp Tf1 target site duplication. The total and average base usage at the 5 bp duplicated target site is indicated. The total number of analysed target sites was 27 and the orientation of the target site is 5′ to 3′ and parallel to the Tf1 element.

