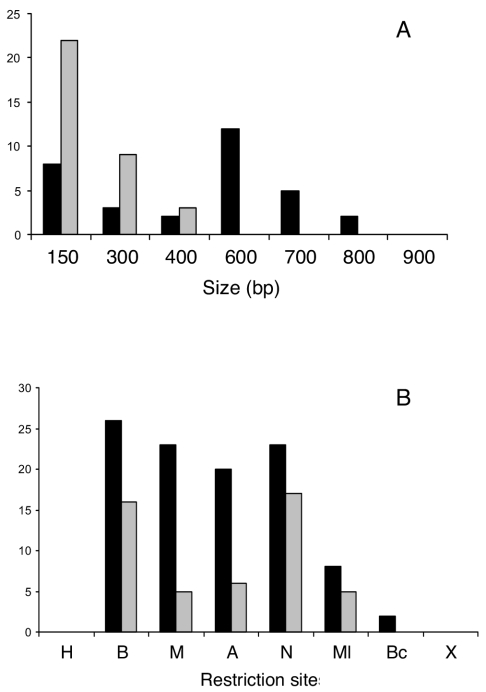
FIG. 5.
Size distribution (A) and positions (B) involved in gene conversion events. Data are derived from Fig. 4. For both panels, vertical black bars represent continuous tracts, while shaded bars correspond to discontinuous tracts. The letters in panel B represent the different RFLPs, as shown in Fig. 1.

