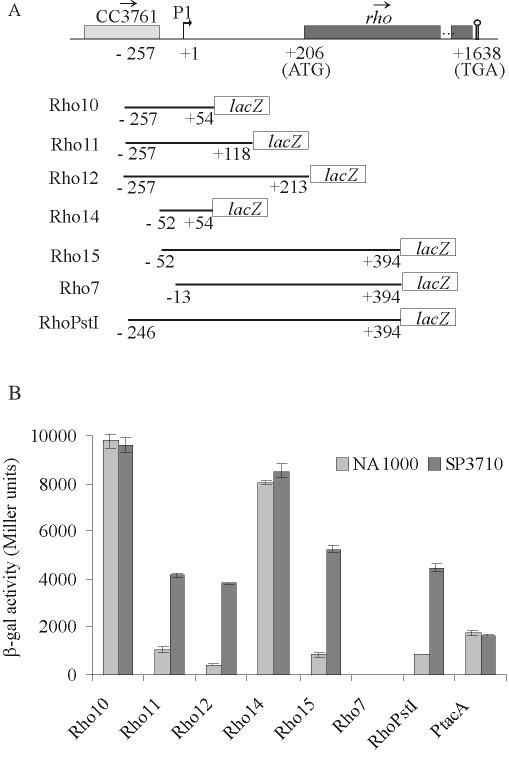
FIG. 3.
Analysis of expression driven by rho regulatory regions. (A) Map (not to scale) of the region surrounding the rho gene in C. crescentus. Boxes indicate open reading frames, and the arrows above them show the direction of transcription. Coordinates in nucleotides are relative to the first nucleotide of the rho transcription start site (bent arrow), determined by primer extension analysis (+1). The promoter is indicated as P1. The stem and loop indicate a putative Rho-independent transcription terminator. Below the map, each transcriptional fusion construct is indicated, where coordinates indicate the extent of the regulatory rho region cloned in front of the reporter lacZ gene. (B) β-Galactosidase activity of each construct in the NA1000 and SP3710 strains. The results are in Miller units (21) and are the average of results of at least three independent assays.

