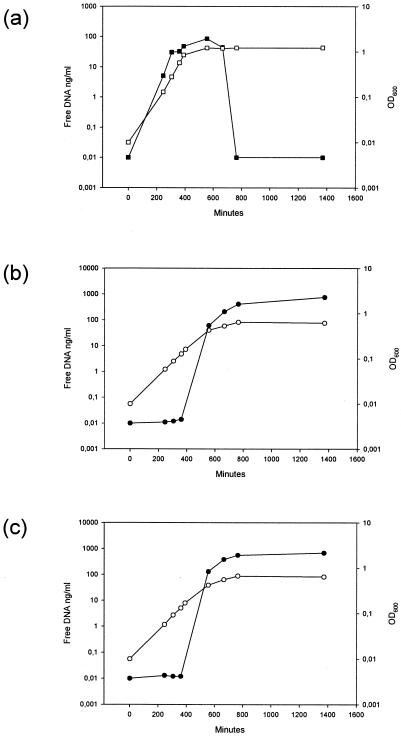
FIG. 8.
Concentration of free DNA during culture growth of the wild type (LT11) in the absence (a) or presence (b) of 1 μM SCSP and of the comGB mutant (SM015) in the presence of 1 μM SCSP (c). Solid symbols indicate the concentration of free DNA (ng/ml), and open symbols indicate the cell density (OD600) as a function of time.

