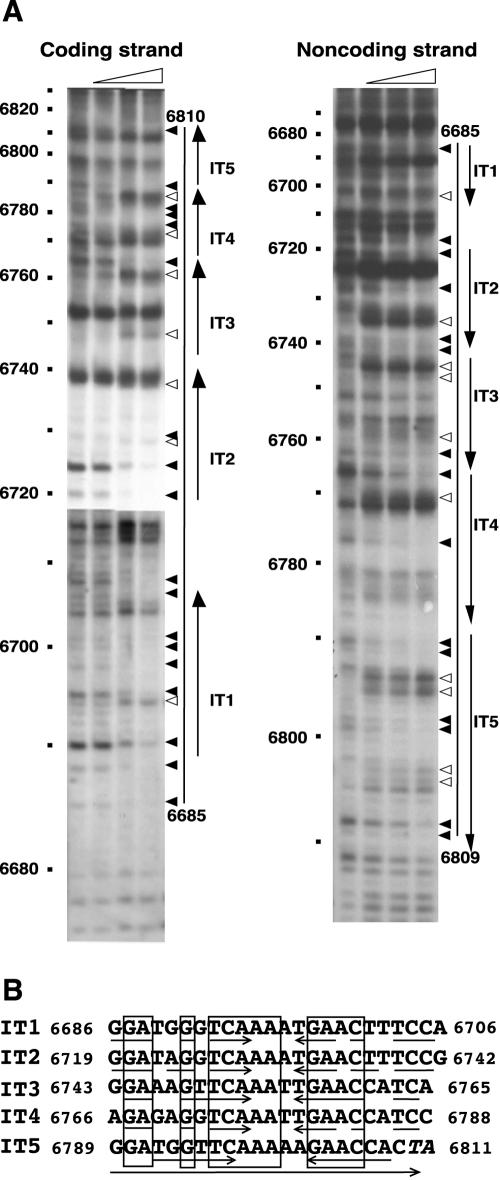
FIG. 5.
DNase I footprinting analysis of the binding region of His-tagged RepN (A) and alignment of the nucleotide sequences protected from the nuclease digestion (B). (A) DNA fragments labeled with biotin at either nt 6634 or nt 6883 were subjected to footprinting analysis as described in Materials and Methods. The reaction mixture contained 0, 0.3, 0.9, and 2.7 μg of His-tagged RepN in a total volume of 45 μl. The triangles above the panels show the increment of His-tagged RepN. The filled and open arrowheads to the right of each panel show the bands decreased and increased in intensity, respec-tively, with increasing amounts of His-tagged RepN. The bars and arrows indicate the protected regions from DNase I and iterons, respectively. In the left panel, two X-ray films with different exposure time were joined for better clarity. (B) The iterons depicted by the large arrow at the bottom are arranged so that their 22 nucleotides show maximum homology. The numbers indicate the positions of the first and last nucleotides of the sequences. The boxes and small arrows show identical nucleotides among the five iterons and inverted repeat sequences in each iteron, respectively. The last two nucleotides shown in italics depict part of the A+T-rich sequence downstream from the iterons (see Fig. 2).

