Figure 1.
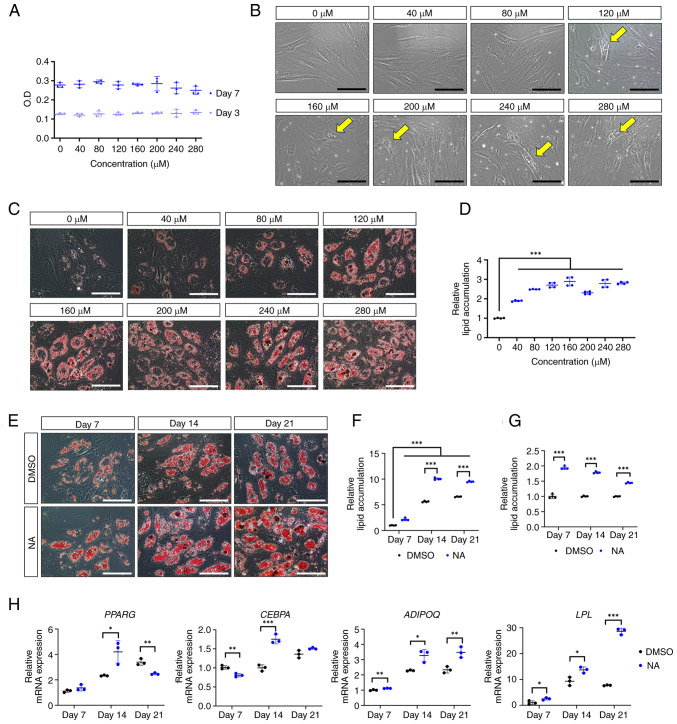
Effect of NA on adipogenesis. (A) Cell viability of AD-MSCs as measured by O.D. values at day 3 and 7 after treatment with DMSO or serial doses of NA. (B) Representative images of AD-MSCs after 72 h of NA treatment. Yellow arrows indicate the oil droplets formed after NA treatment in the normal proliferation condition. Scale bars: 100 μm. (C) Representative images of Oil Red O staining of AD-MSCs on day 7 after adipogenic differentiation and treatment with DMSO or NA. Scale bars: 100 μm. (D) Relative amounts of lipid accumulation after 7 days of adipogenic differentiation in cells treated with DMSO or NA. Statistical significance was assessed by one-way ANOVA: ***P<0.001. (E) Representative images of Oil Red O staining of AD-MSCs after 7, 14 and 21 days of adipogenic differentiation and treatment with DMSO or 160 μM NA. Scale bars: 100 μm. (F and G) Relative amounts of lipid accumulation after 7, 14 and 21 days of adipogenic differentiation and treatment with DMSO or 160 μM NA. (F) Increase in lipid accumulation by differentiation period and NA treatment. Relative lipid accumulation was normalized to the DMSO group at day 7. Statistical significance was assessed by one-way ANOVA: ***P<0.001. (G) Change in lipid accumulation at each differentiation timepoint (7, 14 and 21 days) in the NA group versus the DMSO group. Relative lipid accumulation was normalized to the DMSO group at each time point. Statistical significance was assessed by unpaired Student's t-test: ***P<0.001. (H) Reverse transcription-quantitative PCR analysis of adipogenic markers after 7, 14 and 21 days of adipogenic differentiation and treatment with DMSO or 160 μM NA. Statistical significance was assessed by unpaired Student's t-test: *P<0.05, **P<0.01 and ***P<0.001. Data are presented as the mean ± SD. AD-MSCs, adipose-derived mesenchymal stem cells; DMSO, dimethyl sulfoxide; LPL, lipoprotein lipase; NA, nervonic acid; O.D., optical density.

