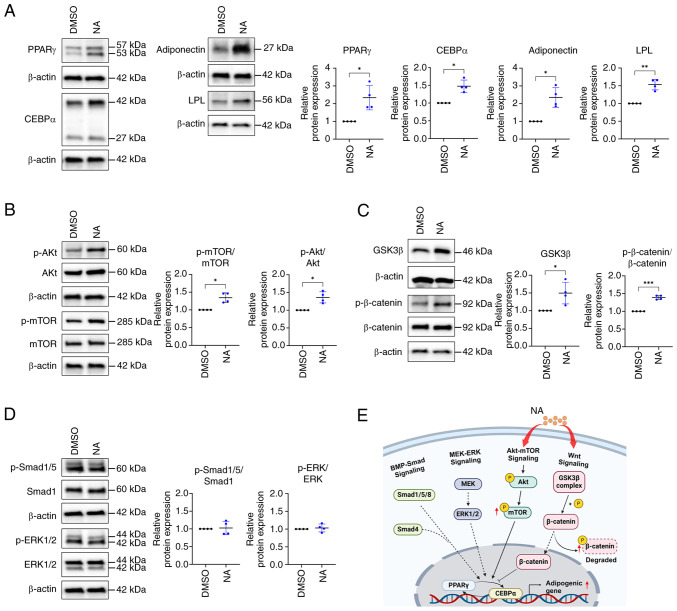
Figure 2.
Signaling pathways regulating adipogenesis are affected by NA. (A) Western blot analysis of adipogenic markers after 14 days of adipogenic differentiation and treatment with DMSO or 160 μM NA. (B) Western blot analysis of Akt and mTOR phosphorylation. (C) Western blot analysis of GSK3β expression and β-catenin phosphorylation. (D) Western blot analysis of Smad1/5 and ERK1/2 phosphorylation. (E) Graphical representation of signaling pathways affected by NA during adipogenesis. Created with BioRender.com. Statistical significance was assessed using unpaired Student's t-test: *P<0.05, **P<0.01 and ***P<0.001. Data are presented as the mean ± SD. DMSO, dimethyl sulfoxide; LPL, lipoprotein lipase; NA, nervonic acid; p-, phosphorylated.

