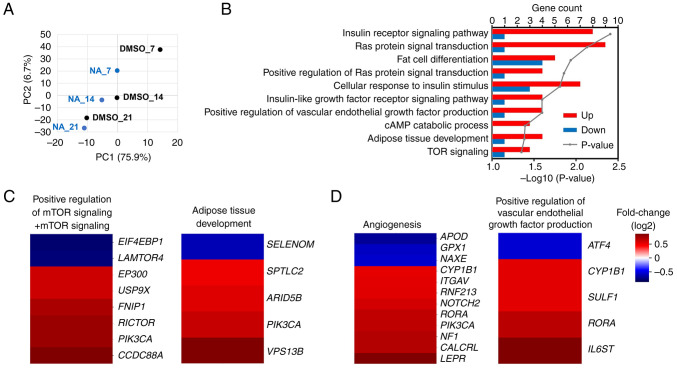
Figure 3.
Transcriptomic changes in differentiating AD-MSCs after NA treatment. (A) Principal component analysis of AD-MSCs treated with DMSO or NA during adipogenesis. (B) Gene Ontology analysis of the biological processes associated with differentially expressed genes in the NA-treated group against the DMSO-treated group at day 7 of adipogenesis. (C) Heatmap of the expression of genes involved in 'mTOR signaling, 'positive regulation of mTOR signaling' (left) and 'adipose tissue development' (right) in the NA-treated group versus the DMSO-treated group. (D) Heatmap of the expression of genes involved in 'angiogenesis' (left) and 'positive regulation of vascular endothelial growth factor production' (right) in the NA-treated group versus the DMSO-treated group. AD-MSCs, adipose-derived mesenchymal stem cells; DMSO, dimethyl sulfoxide; NA, nervonic acid.

