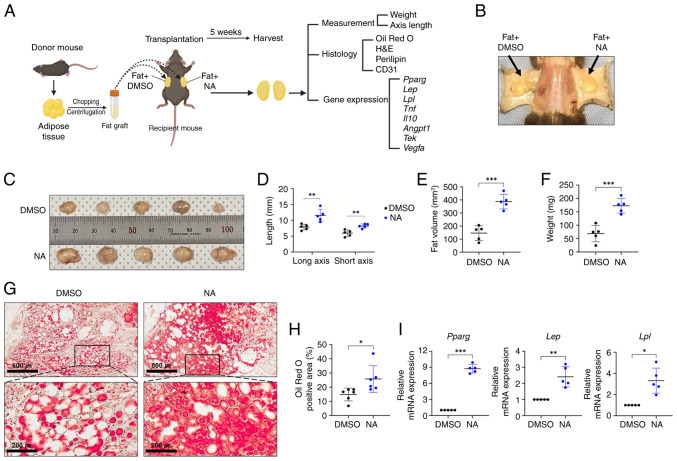
Figure 4.
Effects of NA on adipose tissue engraftment. (A) Images of allogeneic fat transplantation in C57BL/6 mice. Peritoneal fat was processed for adipocyte isolation, implanted subcutaneously and treated with 160 μM NA or an equal volume of DMSO. The grafts were harvested after 5 weeks and were further analyzed. Created with BioRender.com. (B) Images of fat grafts 5 weeks after fat transplantation and treatment with DMSO (left) or NA (right). (C) Images and relative sizes of the isolated fat grafts treated with DMSO or NA after transplantation. (D) Axes lengths, (E) fat volume and (F) fat weight of isolated fat grafts treated with DMSO or NA. (G) Oil Red O staining of fat grafts treated with DMSO or NA. Black boxes in the upper images represent the lower images. Scale bars: 800 μm (upper), 200 μm (lower). (H) Oil Red O-positive area within whole fat grafts after transplantation. (I) Reverse transcription-quantitative PCR analysis of Pparg, Lep and Lpl in the fat grafts. Data are presented as the mean ± SD. Statistical significance was assessed using unpaired Student's t-test: *P<0.05, **P<0.01 and ***P<0.001. DMSO, dimethyl sulfoxide; H&E, hematoxylin and eosin; Lpl, lipoprotein lipase; NA, nervonic acid.

