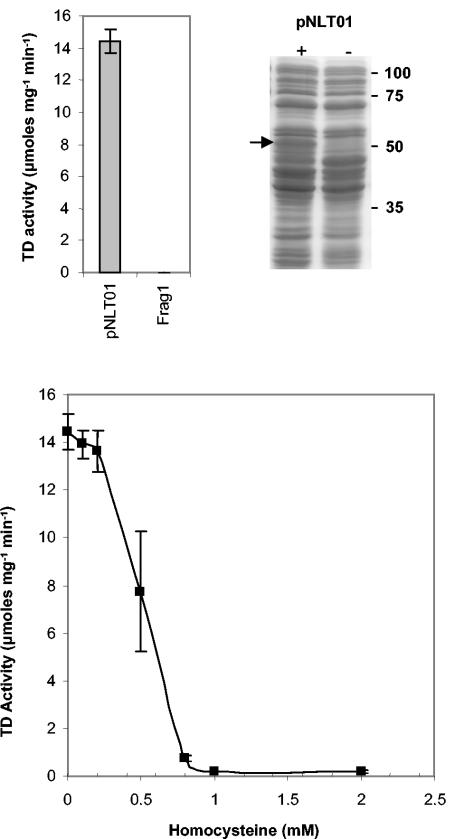
FIG. 9.
TD activity is inhibited by Hcy. (Top left) Cells carrying pNLT01 have increased TD activity. Crude cell extracts were prepared from either Frag1 or Frag1/pNLT01 grown to stationary phase in LB. TD activity was measured from each extract in triplicate, and errors bars indicate the standard deviation from the mean. Assays contained protein concentrations of 0.04 mg ml−1 for Frag1 and 0.01 mg ml−1 for Frag1/pNLT01 extracts. (Top right) Cells carrying pNLT01 express a protein of the size predicted for TD. Proteins extracted from Frag1 and Frag1/pNLT01 were separated by SDS-PAGE. Numbers indicate the sizes of molecular mass markers in kilodaltons. A band with increased intensity migrating at ca. 55 kDa is apparent in extracts from Frag1/pNLT01 and is indicated by an arrow. (Bottom) TD activity was measured as a function of increasing Hcy concentration. Assays were performed in triplicate, and errors bars indicate the standard deviation from the mean. All assays contained 0.01 mg of protein ml−1.

