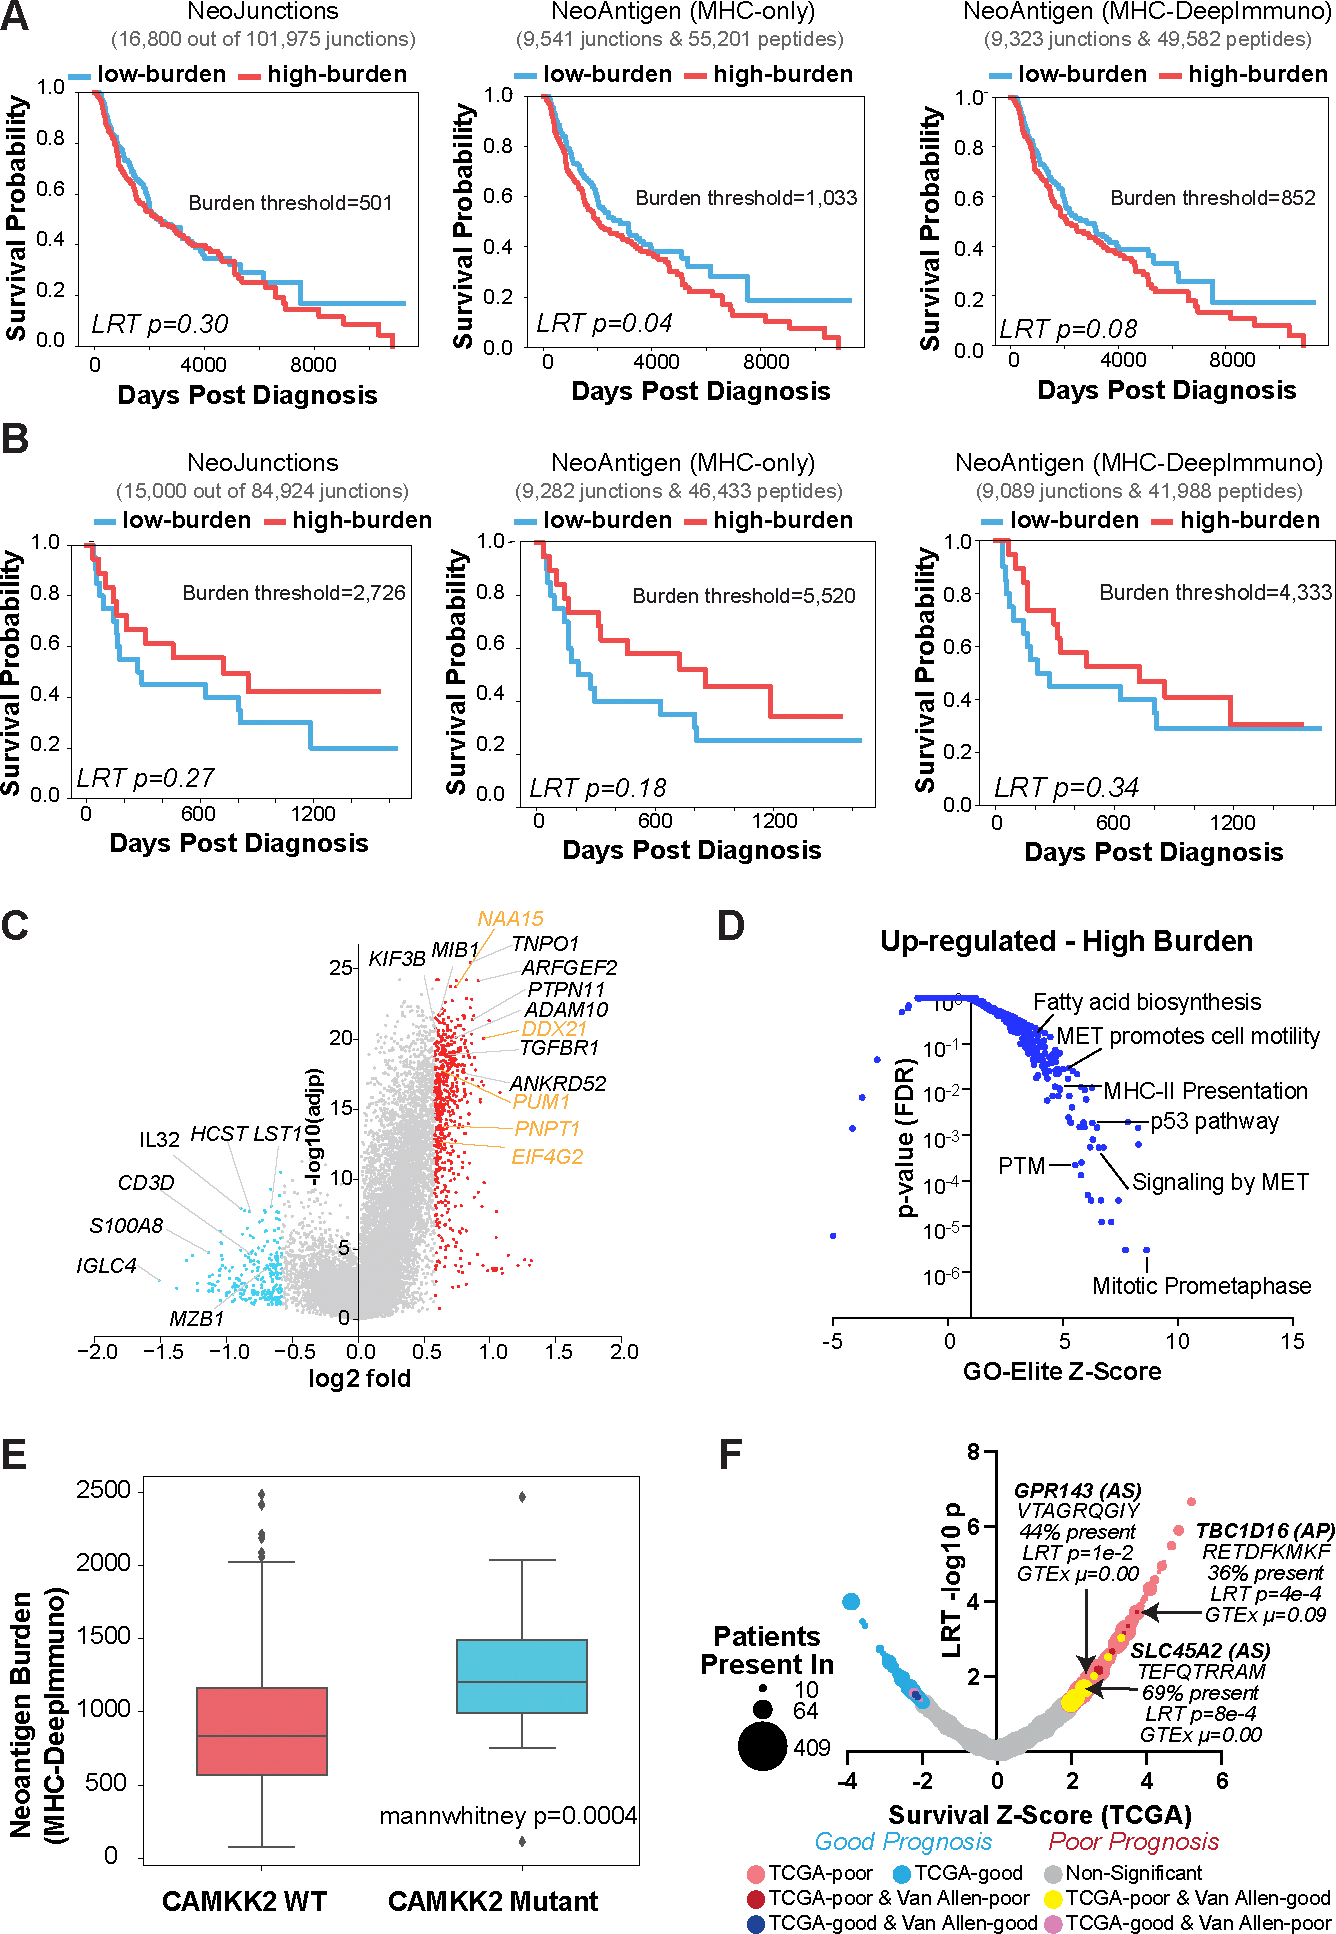
Figure 2. Splicing-neoantigen burden predicts response to therapy in Melanoma.

A,B) Kaplan-Meier (KM) survival plots of Melanoma patient samples stratified into low and high neoantigen burden, considering overall survival for each sequential step in SNAF for two cohorts (A) TCGA (n=472), and (B) Van Allen (n=39). These steps are: 1) tumor-specific neojunctions (left column), MHC-bound neoantigens (middle column) and immunogenic neoantigens (right column). Van Allen cohort RNA-Seq samples were subject to immune checkpoint inhibitors whereas TCGA were not. The number of neojunctions or Neoantigen peptides are shown at the top of each plot. C) Volcano plot of genes differentially expressed in patients with high versus low immunogenic splicing neoantigen burden in TCGA-SKCM, with a fold>1.5 and eBayes t-test P<0.05 (FDR corrected). Red = genes that are up-regulated in the high burden group; blue = down-regulated genes in the high burden; orange = representative RNA binding proteins. D) Gene-set enrichment with GO-Elite of ToppFun pathway gene-sets (AltAnalyze) for genes up-regulated in patients with high splicing versus low neoantigen burden(panel C). E) Immunogenic splicing neoantigen burden between patients in the TCGA Melanoma cohort with or without mutations in CAMKK2. Mann Whitney two-sided test. F) Bubble-plot of survival associated splicing neoantigens from SNAF in TCGA-SKCM. Dot size corresponds to the number of patients with melanoma that the splicing neoantigen is detected in (10–470) and are colored according to their survival significance in the TCGA-SKCM and Van Allen cohorts (LRT P<0.05 and z ≥ 1). AS = alternative splicing.
