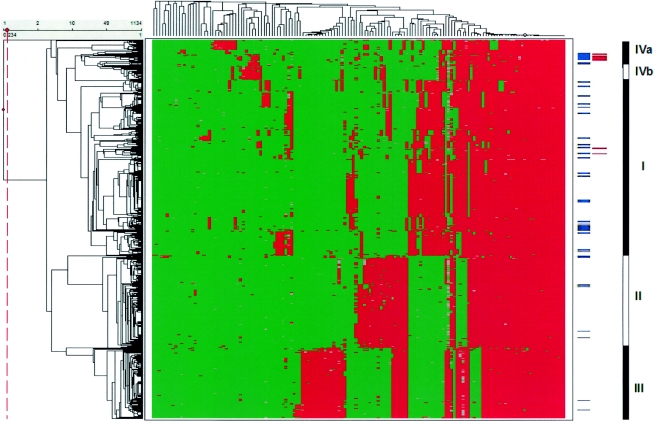
FIG. 2.
Agglomerative two-dimensional clustering of strains (n = 1,133) and AFLP markers. AFLP fingerprints of the animal strains (n = 77) are included. The red fields in the figure represent the presence of AFLP markers; green indicates absence. Blue bars at the right side of the figure indicate the position of each animal strain in the analysis; the red bars represent the mastitis-associated strains. The AFLP database is divided in three main strain clusters (indicated as I, II, and III at the far right of the figure) and two minor clusters (indicated as IVa and IVb) (25).

