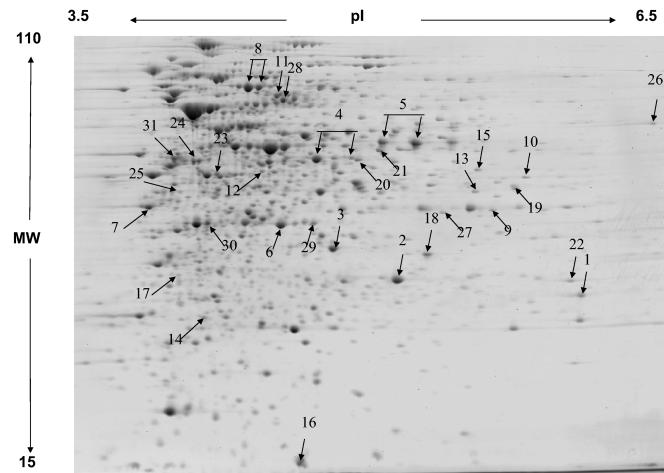
FIG. 3.
2D gel analysis of the proteome of RHA1 grown on PAA. The major proteins associated with phenylacetate catabolism are indicated with arrows. The numbers correspond to spot numbers in Table 2, where the protein names and corresponding ORFs are listed. MW, molecular weight (in thousands).

