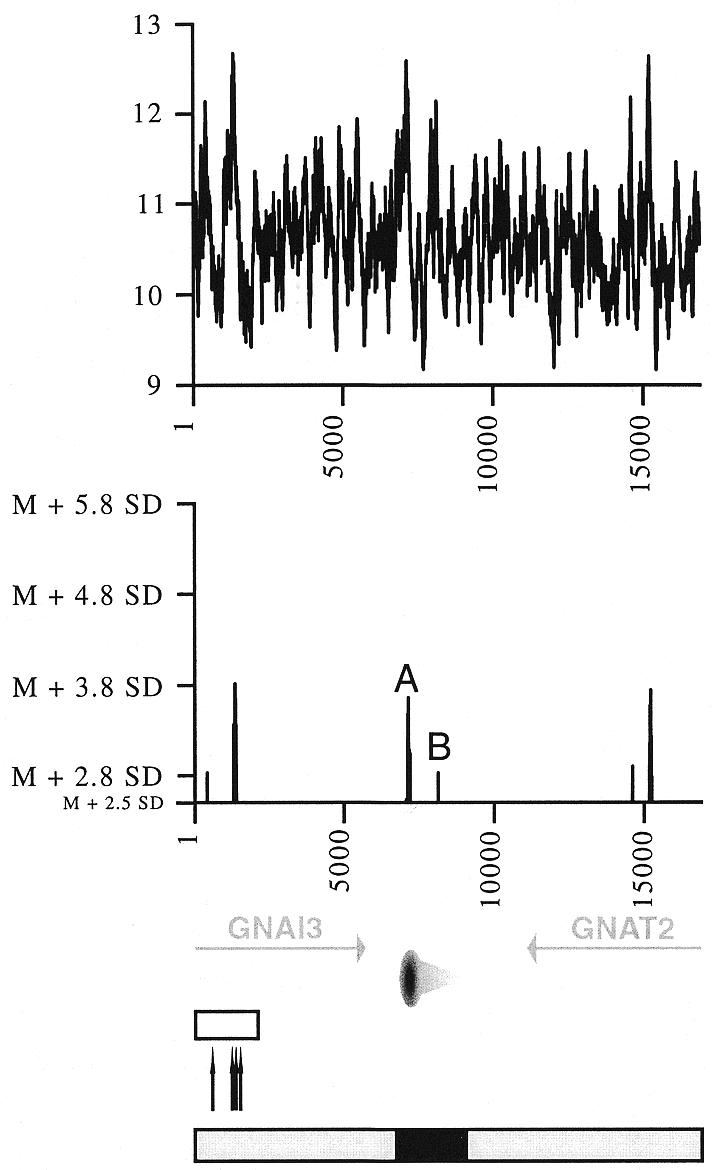
Figure 2.

Flexibility analysis of the Chinese hamster GNAI3–GNAT2 region. Helix flexibility in the GNAI3–GNAT2 region was calculated with FlexStab, and values were plotted against the map of the region. Results are presented in two ways. Top graph, the vertical axis shows degrees of inclination of the twist angle (absolute values) and the horizontal axis indicates nucleotide position of each analysed 100 bp window. Bottom graph, the horizontal axis is as before, and the vertical axis shows relative flexibility peak values, i.e. values that are significantly above the mean value for the entire analysed sequence (mean value M = 10.601006°, SD = 0.542673). Only values >2.5 SD above the mean are shown. The two peaks close to the origin are designated as A and B, their precise location in sequence Y08232 are nucleotides 1533 and 2532, respectively. Bottom, map of the region, with the 3′ end of the GNAI3 gene and the GNAT2 gene (grey arrows, transcription directions), the oriGNAI3 replication origin (oval with a grey radial gradient, region where most replication initiation events occur; light grey triangle, region in which initiation events are very rare). Open box, hot spot for recombination; black arrows, sites of rearrangement or pseudogene insertion. Below this map are represented the initiation region (black box) and regions where no initiation events were detected (grey boxes); see Figure 4 for the peak distribution analysis.
