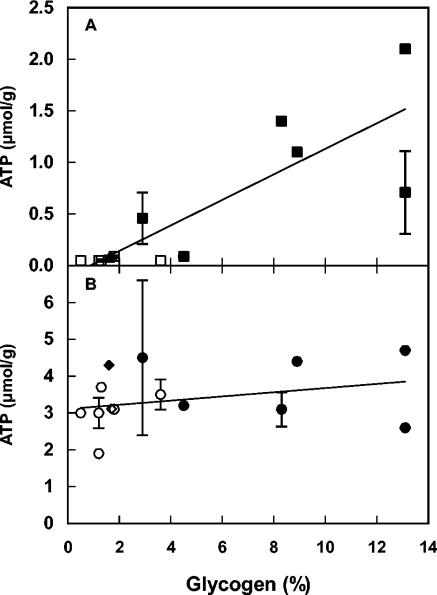
FIG. 2.
Glycogen content (percentage of dry weight) versus ATP level (in micromoles per gram [dry weight]) after carbon starvation (A) and nitrogen starvation (B). Growth and starvation conditions are indicated by the following symbols: ▪, carbon-limited growth followed by carbon starvation; □, nitrogen-limited growth followed by carbon starvation; •, carbon-limited growth followed by nitrogen starvation; ○, nitrogen-limited growth followed by nitrogen starvation; ▴, carbon-limited in the presence of 5 mM benzoic acid followed by carbon starvation; ▵, nitrogen-limited growth in the presence of 5 mM benzoic acid followed by carbon starvation; ⧫, carbon-limited growth in the presence of 5 mM benzoic acid, followed by nitrogen starvation; ◊, nitrogen-limited growth in the presence of 5 mM benzoic acid, followed by nitrogen starvation. Error bars indicate standard deviation when >10% of the value of the point. The error bars for glycogen content indicate standard deviation, calculated from two separately analyzed samples originating from the same fermenter cultivation. The error bars for ATP levels indicate standard deviation from the level measured in two separately starved cultures originating from the same fermenter cultivation. The lines are linear regressions (samples with benzoic acid were omitted) with R2 = 0.69 (A) and R2 = 0.10 (B), respectively.

