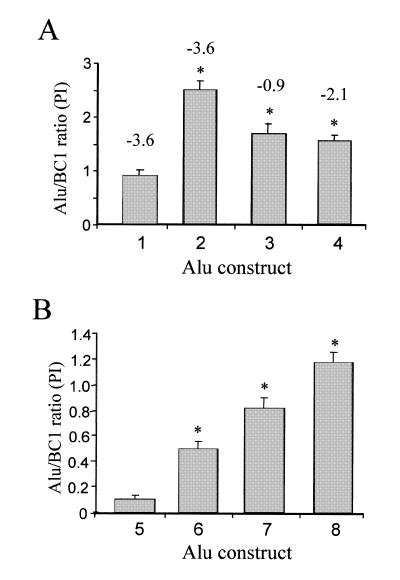
Figure 3.
Alu RNA expression from constructs with altered pol III terminator regions. Each experiment consists of a co-transfection of the individual plasmid with the internal control, p7SLBC1BC1. The Alu/BC1 ratios (n ≥ 7) were calculated by dividing the amount of Alu RNA by the amount of BC1 RNA detected and expressed as Phosphoimager (PI) units. The bars represent the means ± the standard error of the mean (SEM). Asterisks indicate P < 0.05 from ANOVA tests when compared to p7SLSxBC1 (1) or p–416Ya5-31274223 (5). (A) The effect of different pol III terminator sequences on Alu expression. The following constructs were evaluated: 1, p7SLSxBC1–tm (n = 12) SEM ± 0.118; 2, p7SLSxBC1 (n = 12) SEM ± 0.176; 3, p7SLSxBC1–B1 (n = 7) SEM ± 0.188; 4, p7SLSxBC1-5S (n = 9) SEM ± 0.103. The numbers on top of the bars represent the stability values (kcal/mol) as determined from mfold analyses (45,46). (B) Effect of the endogenous 3′ end on RNA expression from a specific genomic Alu element. The following constructs were evaluated: 5, p–416Ya5-31274223 (n = 8) SEM ± 0.032; 6, p–416Ya5-31274TTT (n = 7) SEM ± 0.072; 7, p7SLYa5-31274223 (n = 8) SEM ± 0.090; 8, p7SLYa5-31274TTT (n = 8) SEM ± 0.086. No secondary structure formation was detected by mfold analyses.

