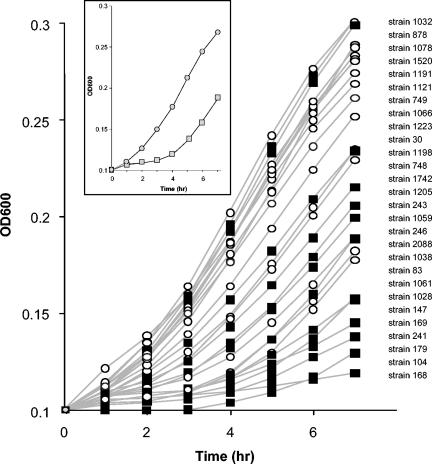
FIG. 4.
Plot of growth of GadD1-positive (circles) and GadD1-negative (squares) strains in TSB-YE, pH 5.1, as determined by OD600. The strains are listed in order of descending OD600 after 7 h. (Inset) The mean growth of the GadD1-positive (grey circles) and GadD1-negative (grey squares) strains is presented as trend lines.

