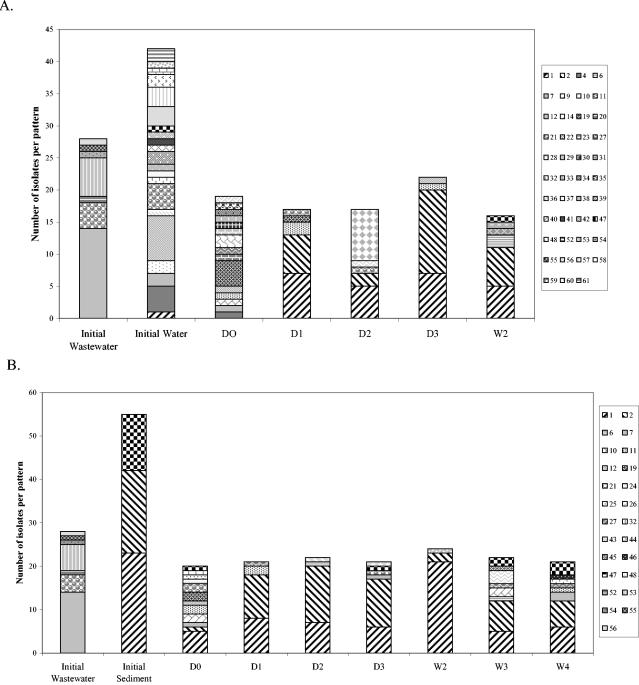
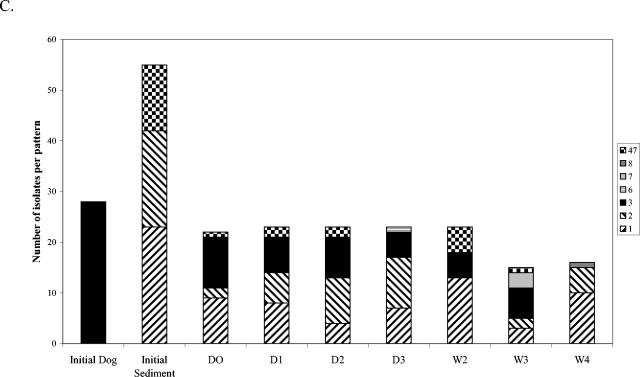
FIG. 1.
E. coli ribotype distribution in freshwater mesocosms inoculated with wastewater or dog feces. Each column pattern represents a different ribotype, and patterns that appear in separate graphs represent the same ribotype. Ribotypes from the initial inoculum sample are represented by the first bar on each graph, and ribotypes from the water sample or sediment before inoculation are also included. (A) Water column of wastewater mesocosms; (B) sediment of wastewater mesocosms; (C) sediment of dog feces mesocosms. D, day; W, week.


