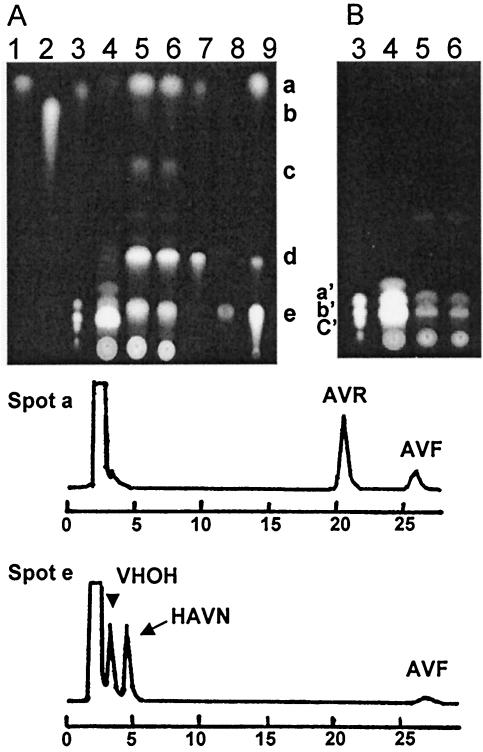
FIG. 5.
Characterization of the pigments in the vbs disruptant VBS-DD1-16. Acetone extracts of the mycelia of A. parasiticus SYS-4 (lane 4, 3 μl) and VBS-DD1-16 (lane 5, 3 μl; lane 6, 2 μl) were analyzed by TLC together with precursors (lane 1, AVR; lane 2, VB; lane 3, VA and aflatoxins B1, B2, G1, and G2; lane 7, OAVN; lane 8, VHOH; lane 9, HAVN). Two kinds of conditions for taking fluorescence photographs were used for the same TLC plate to detect red or orange fluorescence of the precursors (A) and blue or green fluorescence of aflatoxins (B). Each spot from the acetone extract of VBS-DD1-16 (A) was extracted and analyzed by HPLC. HPLC chromatograms of spots a and e are shown below the TLC plates. The first peak of the HPLC chromatogram corresponded to the solvent. The spots in panel A corresponded to the following compounds: spot a, AVR and AVF; spot b, VB; spot c, AVN; spot d, OAVN; and spot e, HAVN and VHOH. The standards in panel B were aflatoxin B1 (spot a′), aflatoxins G1 and B2 (spot b′), and aflatoxin G2 (spot c′)

