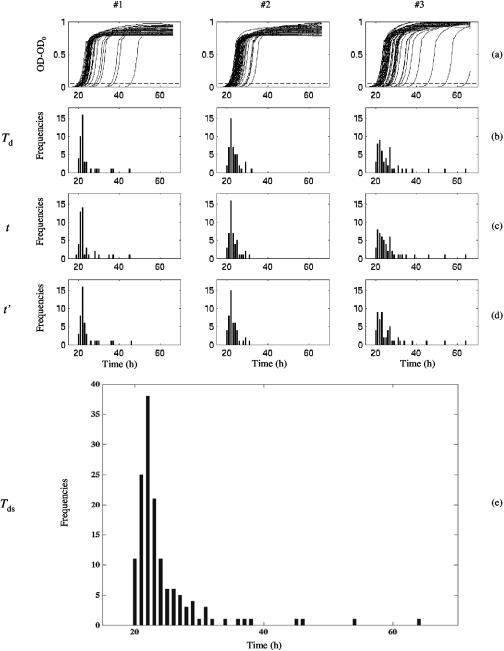
FIG. 1.
Standardization steps of detection time values for the three datasets (#1, #2, and #3) of L. monocytogenes cells stressed by chlorine. (a) Optical density growth curves at 600 nm (OD-OD0) in TSBye at 30°C of the wells showing growth. Dashed line: limit of detection (OD0 + 0.05). (b) Histogram of observed detection times (Td) issued from OD growth curves. (c) Histogram of transformed detection times after the first step of standardization (t). (d) Histogram of transformed detection times after the second step of standardization (t′). (e) Histogram of the cumulated values of t′ of the three datasets (Tds).

