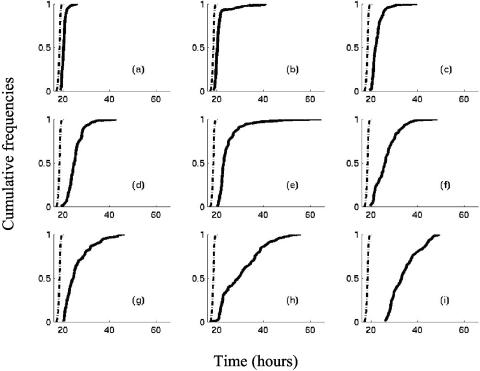
FIG. 3.
Observed cumulative distributions of the standardized detection times of L. monocytogenes in TSBye at 30°C. Dashed line: cumulative distribution of Tds (in hours) for wells inoculated with cells in the exponential growth phase. Continuous curves: cumulative distributions of observed Tds for wells inoculated with cells previously stressed by (a) HCl, (b) cold, (c) lactic acid, (d) NaOH, (e) chlorine, (f) starvation, (g) NaCl, (h) BAC, and (i) heat.

