Figure 1.
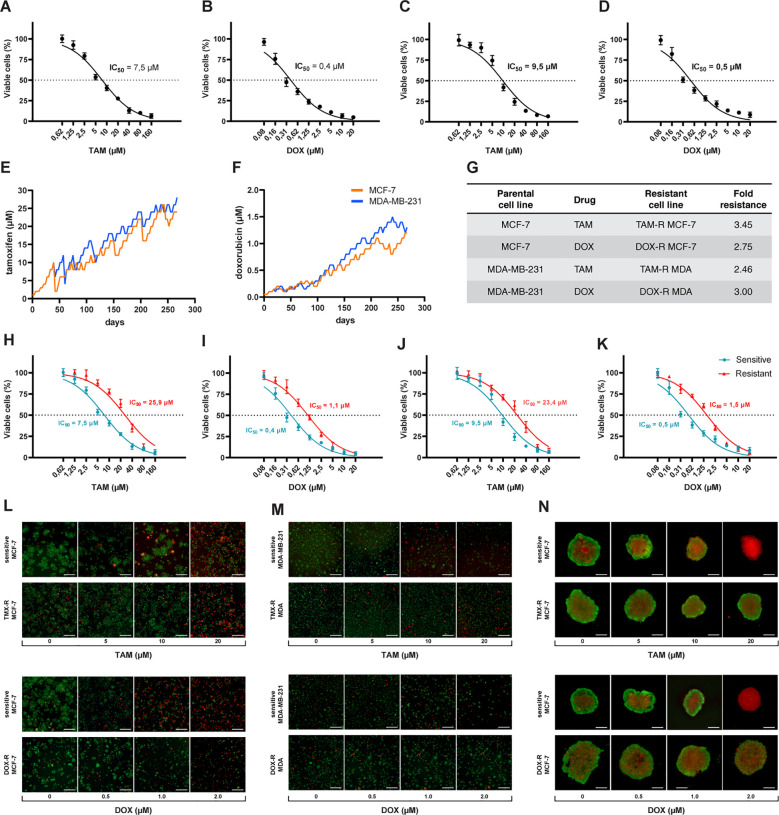
Process of generation of resistant cancer cells. Initial cell viability assay by resazurin reduction and half maximal inhibitory concentration (IC50) of sensitive MCF-7 cells treated with (A) tamoxifen (TAM) and (B) doxorubicin (DOX) and of MDA-MB-231 treated with (C) TAM and (D) DOX. Sensitive cells of MCF-7 and MDA-MB-231 exposed to (E) TAM and (F) DOX over time to generate resistant cell lines. The resistance fold calculated for each resistant cell line (G), indicating the level of resistance for each drug. The IC50s of (H) TAM- and (I) DOX-resistant MCF-7 and (J) TAM- and (K) DOX-resistant MDA-MB-231 cells calculated (red line) and compared to sensitive cells (blue line). The IC50s calculated by a nonlinear regression with an adjusted confidence level of 95%. The visualization of TAM- and DOX-resistant (L) MCF-7 and (M) MDA-MB-231 cells in a two-dimensional in vitro setup, and (N) in three-dimensional spheroids of sensitive and resistant MCF-7 cells.

