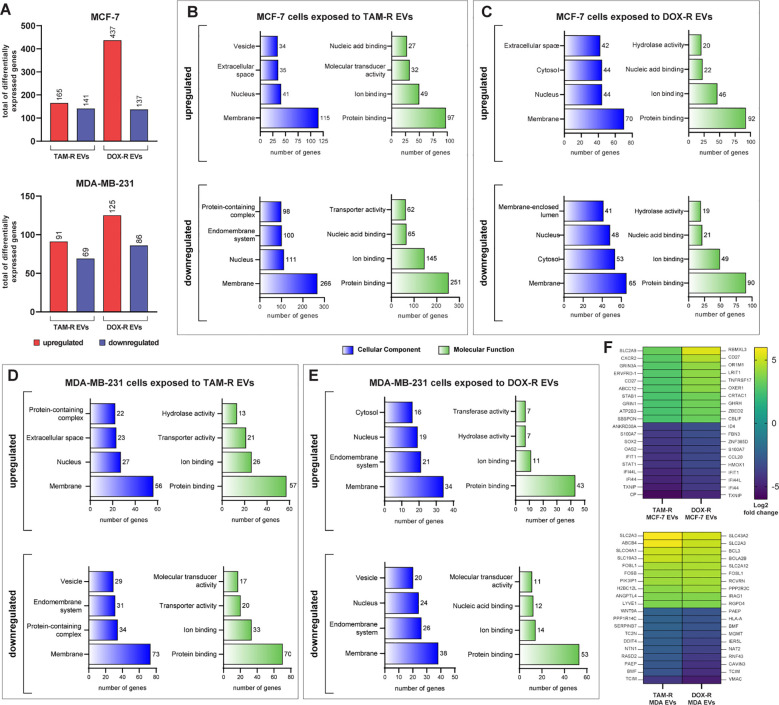
Figure 4.
Transcriptome-wide analysis showing the differential expression in sensitive breast cancer cell lines exposed to resistant extracellular vesicles (EVs) for 24 hours. (A) Histogram of the total number of differentially expressed genes (DEGs) in MCF-7 and MDA-MB-231. Distribution of gene ontology (GO) slim terms associated with MCF-7 transcripts after tamoxifen-resistant EVs (TAM-R EVs) exposure (B) and doxorubicin-resistant EVs (DOX-R EVs) exposure (C). For MDA-MB-231, the distributions of GO-slim enriched terms after TAM-R and DOX-R EV exposure are shown in (D, E), respectively. (F) Heatmap showing each condition’s top 10 up- and downregulated genes based on their log2 fold change.

