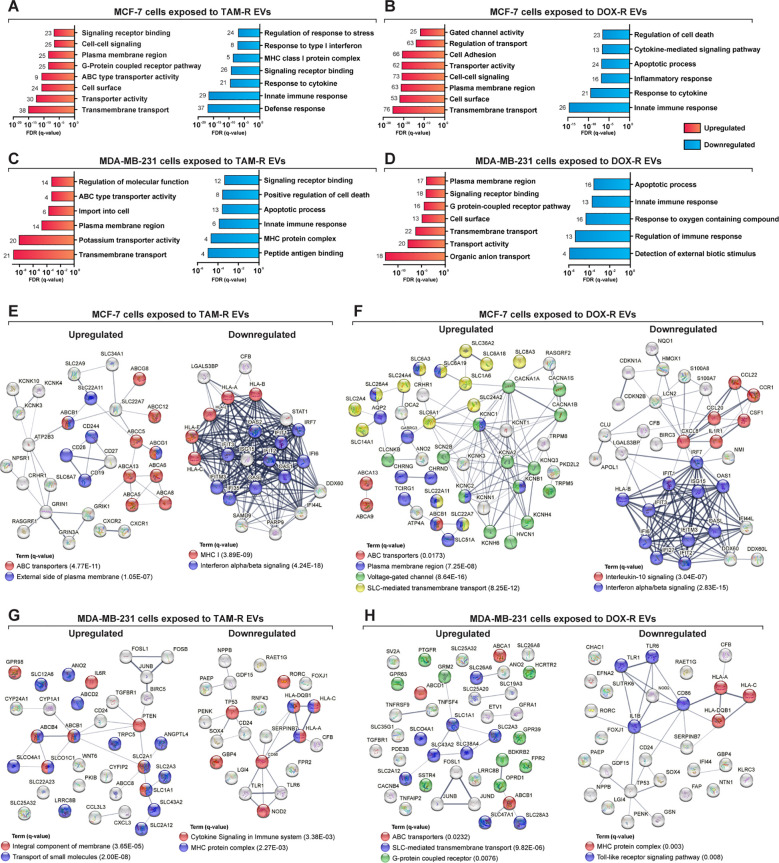
Figure 5.
Deep over-representation analysis of the differentially expressed genes (DEGs) in breast cancer cells exposed to extracellular vesicles (EVs) released by tamoxifen-resistant (TAM-R) and doxorubicin (DOX-R) cell lines. The gene ontology (GO) analysis enriched more specific terms considering the up- and downregulated DEGs in sensitive MCF-7 cells exposed to (A) TAM-R EVs and (B) DOX-R EVs for 24 h For sensitive MDA-MB-231 cells, the enriched terms for up- and downregulated DEGs after exposure to TAM-R and DOX-R EVs are displayed in (C, D), respectively. The number in front of each bar represents the total of enriched DEGs for each term. The x-axis of A to D represents the adjusted p-value (q-value) with a false discovery rate of 1%. Protein-protein interaction networks were generated using the DEG lists as references. (E, F) display the networks created by the MCF-7 DEGs after exposure to TAM-R and DOX-R EVs, respectively. For MDA-MB-231 cells, the exposure of TAM-R and DOX-R EVs generated the networks represented in (G, H), respectively.

