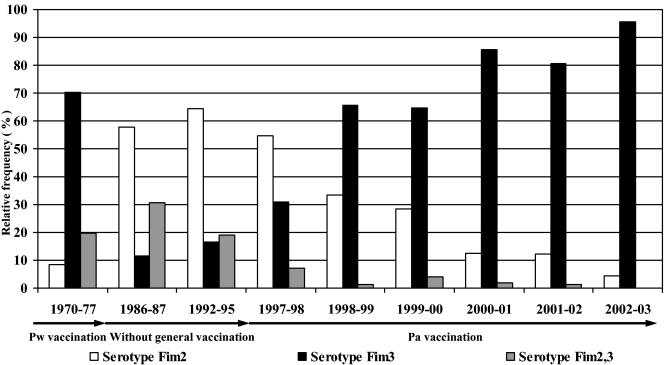
FIG. 2.
Serotype distributions for the Pw period (up to 1979), the vaccine-free period (1979 to 1996), and the Pa period (from 1996 on) as indicated by arrows below the years. The bars show the proportions of serotype Fim2, serotype Fim3, and serotype Fim2,3. The figures are given as proportions (percent) of typed isolates from vaccinees during the respective periods or years.

