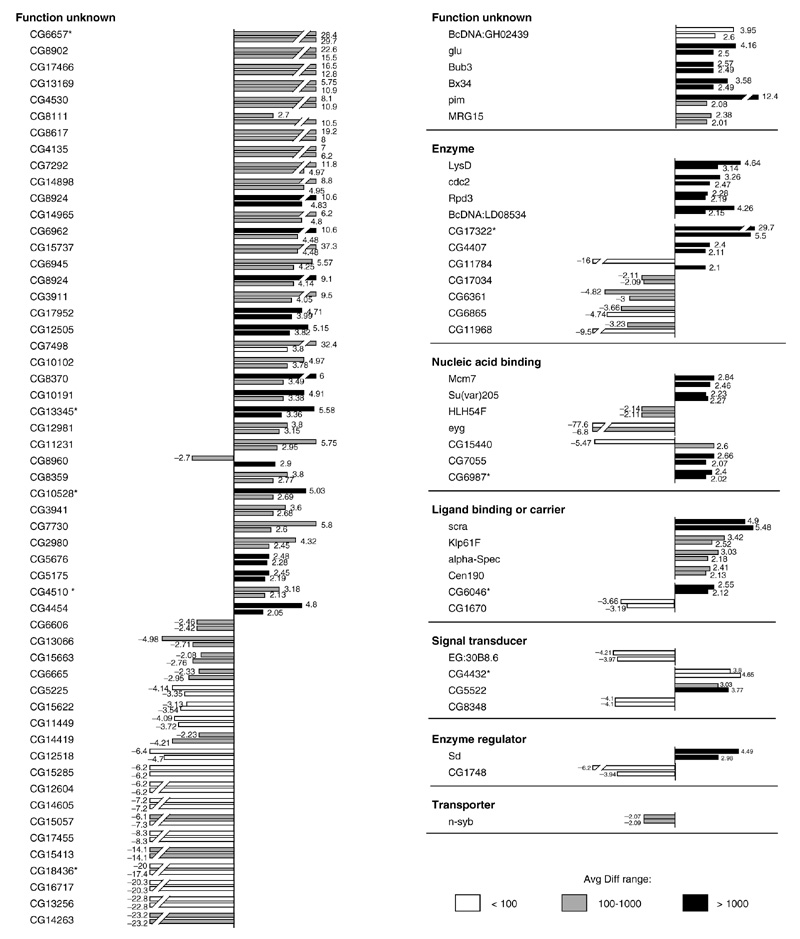
Figure 4.

Transcripts differentially expressed in response to overexpression of otd and in response to overexpression of human Otx2, grouped according to functional classes. Bars represent the fold change between differentially expressed transcripts in heat-shocked wild type embryos and heat-shocked otd or heat-shocked Otx2 embryos. The upper bars represent the fold change of differentially expressed transcripts following overexpression of Otx2 and the lower bars represent the fold change of differentially expressed transcripts following overexpression of otd. Positive values indicate that the relative expression level of a gene is increased (upregulated) following otd overexpression and negative values indicate a decrease (downregulated). Avg Diff values are given for the otd overexpression condition as follows: white bars, Avg Diff < 100; gray bars, Avg Diff from 100-1,000; black bars, Avg Diff > 1,000.
