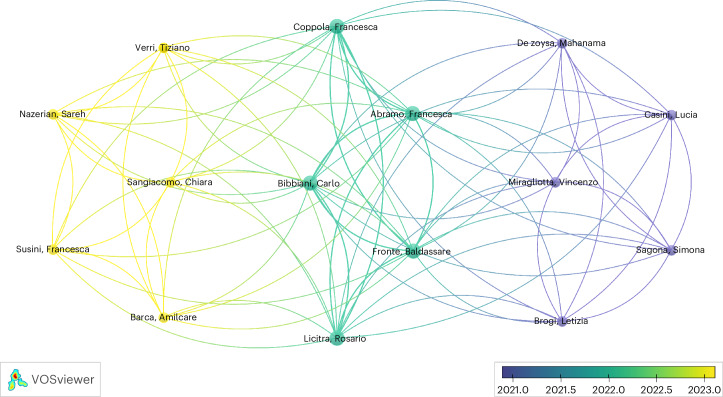
Fig. 3. Co-authorship network analysis of researchers that authored studies assessing the effect of diet on growth.
Authors are color-coded from violet (older studies) to yellow (most recent studies) indicating the average publication year of the studies published by each researcher. The size of the circles represents the number of studies published by each author. The distance between the two circles indicates the correlations between researchers.

