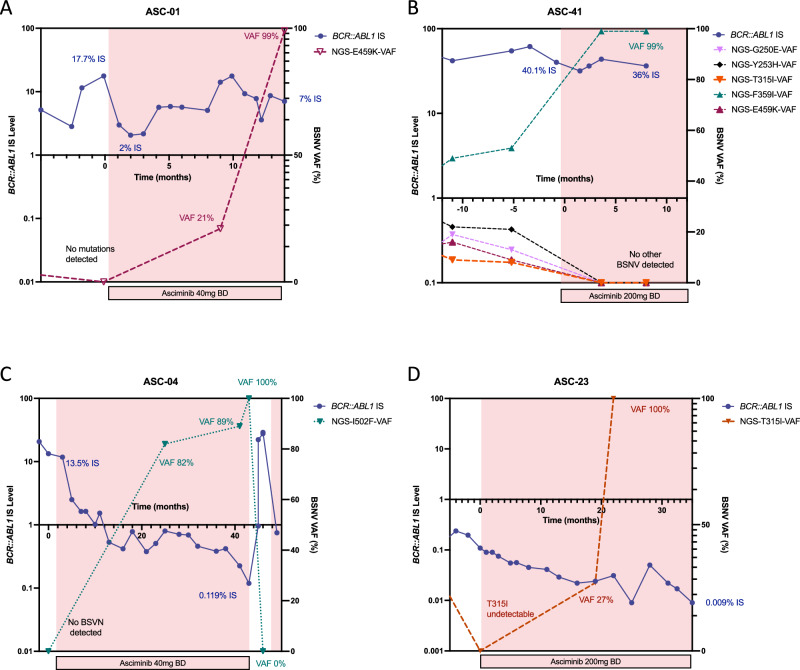
Fig. 4. BCR::ABL1 single nucleotide variant dynamics over time.
A patient ASC-01, BCR::ABL1 IS level (blue) and E459K-BSNV VAF (purple) over time, starting before (white background), then during treatment with asciminib (pink background), until asciminib cessation, B patient ASC-41, BCR::ABL1 IS level (blue), and G250E- (lavender), Y253H- (black), T315I- (orange), F359I- (green), E459K- (maroon) BSNV VAF over time, before (white background) and during (pink background) asciminib treatment C patient ASC-04, BCR::ABL1 IS level results (blue) and I502F-BSNV VAF (teal) before (white background) and during (pink background) asciminib treatment, D patient ASC-23, BCR::ABL1 IS level (blue) and T315I-BSNV VAF (orange) before (white background) and during (pink background) asciminib treatment. BCR::ABL1 IS level (left y-axis), BSNV expressed as variant allele frequency (right y-axis) over time (months, x-axis), BSNV, BCR::ABL1 single nucleotide variant, VAF, variant allele frequency, BD, bis in die, twice a day, IS, international scale.

