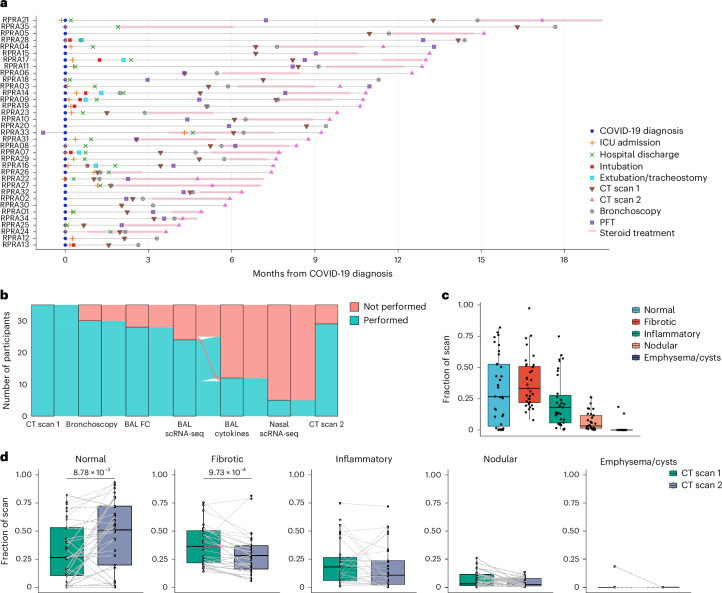
Fig. 1. Patients with RPRA exhibit fibrotic abnormalities on CT imaging that improve with time.
a, Schematic representation of the clinical course and selected diagnostic tests and interventions in 35 patients with RPRA beginning at the time of their diagnosis with COVID-19 (patients RPRA01–RPRA35). Timing of key events such as COVID-19 diagnosis, ICU admission, hospital discharge, intubation, extubation, tracheostomy, first and second CT scans of the chest (CT scans 1 and 2, respectively), bronchoscopy, pulmonary function testing (PFT) and steroid treatment are annotated as symbols on the day of post-COVID-19 diagnosis on which they occurred or as horizontal bars indicating their onset, duration and endpoint in the months post-COVID-19 diagnosis. b, Sankey diagram showing the flow of research or clinical procedures performed or not performed on the cohort analyzed in the present study. These include CT scans 1 and 2, bronchoscopy, BAL fluid flow cytometry (BAL FC), BAL scRNA-seq, measurement of BAL fluid cytokine and chemokine levels (BAL cytokine) and nasal curettage sampling for scRNA-seq (nasal scRNA-seq). c, Quantification of CT scan abnormalities on CT scan 1 in patients with RPRA (n = 35), using a machine learning algorithm and classified as normal lung, fibrotic abnormalities, inflammatory abnormalities, nodularity and emphysema or cysts (Extended Data Table 3). d, Changes in radiographic abnormalities between CT scan 1 and CT scan 2 in patients with RPRA who underwent CT scan 2 (n = 29). Each CT scan is represented by a single point. Scans of the same participant are connected. Adjusted P values are shown above pairs of boxplots when changes were significant (q < 0.05, paired Wilcoxon’s rank-sum tests with FDR correction).

