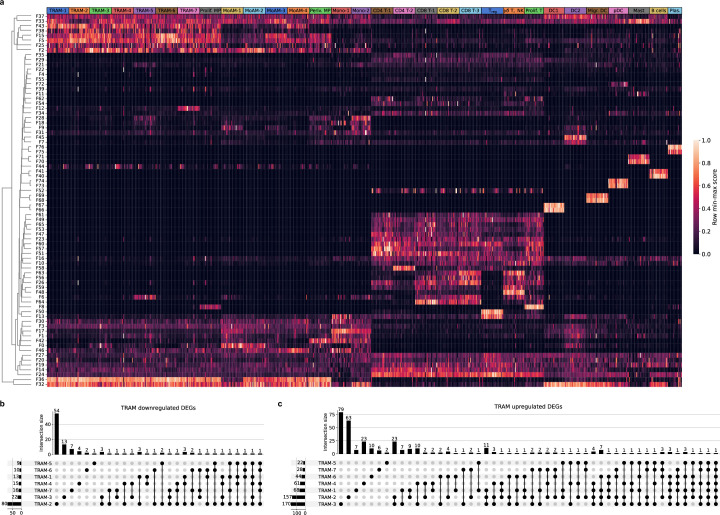
Extended Data Fig. 4. Gene programs associated with pulmonary fibrosis in monocyte-derived alveolar macrophages are associated with severity of radiographic abnormalities in patients with RPRA.
a. Heatmap of subject scores for Spectra programs within each cell type for each of 24 patients with RPRA and 6 healthy control subjects. Each column represents a single patient or subject. Rows are min-max scaled and are hierarchically clustered. Labels refer to clusters identified from the single-cell RNA-seq object in Fig. 3a. Tissue-resident alveolar macrophages (TRAM) clusters 1-7, proliferating macrophages (Prolif. MP), monocyte-derived alveolar macrophages (MoAM) clusters 1-4, perivascular macrophages (Periv. MP), monocytes (Mo) cluster 1-2, CD4 T cells (CD4 T) clusters 1,2, CD8 T cells (CD8 T) clusters 1-3, regulatory T cells (Treg), gd T cells and NK cells (gd T, NK), proliferating T cells (Prolif. T), type I conventional dendritic cells (DC1), type II conventional dendritic cells (DC2), migratory dendritic cells (Migr. DC), plasmacytoid dendritic cells (pDC), Mast cells (Mast), plasma cells (Plas.). b. Upset plot showing downregulated differentially expressed genes (DEGs) shared between TRAM subsets. c. Upset plot showing upregulated DEGs shared between TRAM subsets.

