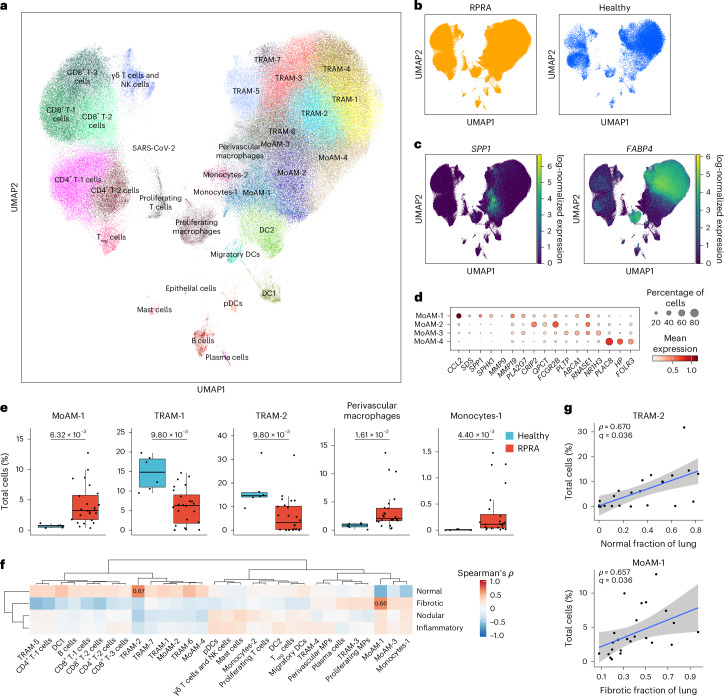
Fig. 3. Ongoing recruitment of profibrotic monocyte-derived alveolar macrophages is associated with fibrotic abnormalities on CT scans.
a, Uniform manifold approximation and projection (UMAP) plot showing integrated analysis of BAL immune cells from patients with RPRA (n = 24) and healthy volunteers (n = 6). Tissue-resident alveolar macrophages (TRAM), monocyte-derived alveolar macrophages (MoAM), type I conventional DCs (DC1), type II conventional DCs (DC2), migratory dendritic cells (migratory DC) and plasmacytoid dendritic cells (pDC). b, UMAP as in a with cells originating from patients with RPRA or healthy controls. c, Expression of SPP1 and FABP4 on the UMAP plot in a. d, Dot plot showing the expression of marker genes for subsets of monocyte-derived alveolar macrophages in the UMAP plot in a. e, Proportions of significantly differentially abundant cell clusters represented in the UMAP in a (q < 0.05, pairwise Wilcoxon’s rank-sum tests with FDR correction). Padj values are shown above each pair of boxplots. f, Hierarchical clustering on correlation coefficients (Spearman’s ρ) between cell-type abundances determined using scRNA-seq in the patients with RPRA (n = 24) as in a and features identified in CT scan 1 as in Fig. 1c. Correlation coefficients are shown only when the association was significant (q < 0.05, permutation tests with FDR correction). Clustering was performed using Ward’s method. g, Comparison between abundance of TRAM-2 and MoAM-1 cell subsets and the fraction of normal and fibrotic lung, respectively, in patients with RPRA (n = 24) as identified by CT scan 1 in Fig. 1c. Only significant associations are shown, with the correlations (Spearman’s ρ) and Padj values or FDR-adjusted q values shown on each plot. Linear models and 95% confidence intervals (CIs) are shown.

