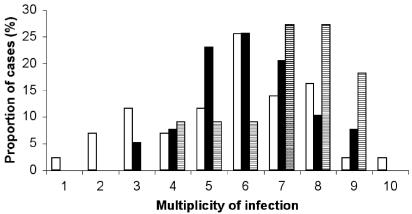
FIG. 1.
Results of combining the msp-1 and msp-2 genotyping data. The percentages of samples with different multiplicities of infection in the peripheral (black), placental (white), and cord (hatched) blood samples were calculated. Primers used were msp-1 f-5′-CACATGAAAGTTATCAAGAACTTGTC-3′ (sense, fluorescein labeled) and 5′-GTACGTCTAATTCCATTTGCACG-3′ (antisense) and msp-2 f-5′-GAAGGTAATTAAAACATTGTC-3′ (sense, fluorescein labeled) and 5′-GAGGGATGTTGCTGCTCCACA-3′ (antisense).

