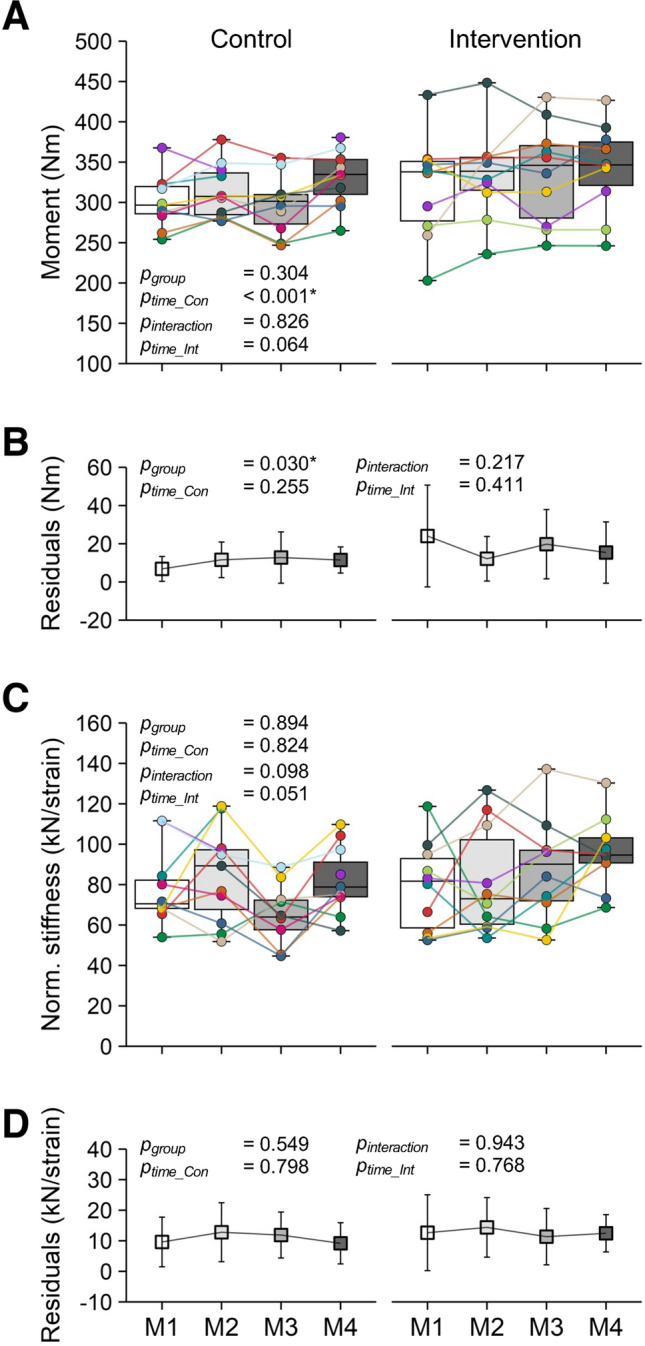
Fig. 4.

Maximum resultant knee joint moment (A) and normalized stiffness (C) in the control group (left; n = 12) and intervention group (right; n = 10) during a competitive season at four measurement time points (M1 to M4). Please note that, in the control group, one athlete each in M1 and M4, and two in M3 were not able to attend the measurements. The colored markers represent individual values, and the median of the sample is shown within the boxes (horizontal line). Below (B, D) are the respective average residuals of the linear mixed model (mean ± SD). The p-values refer to differences between groups at M1 (pgroup), the slope of the changes over time within the control (ptime_Con) and intervention group (ptime_Int), and time-by-group interactions (pinteraction); *significant effect (p < 0.05)
